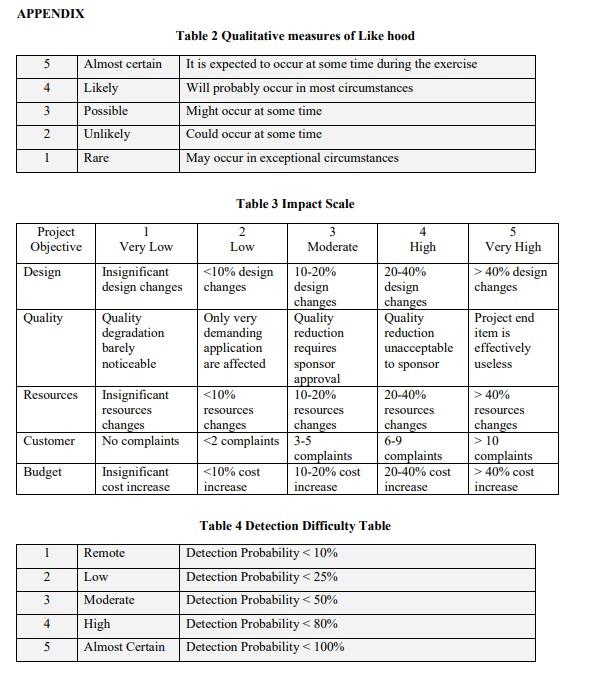
Question: QUESTION 4 Tabulate the risk event based on the following scenario. Refer to Table 2 Likehood matrix, Table 3 Impact Scale and Table 4 Detection

QUESTION 4

Tabulate the risk event based on the following scenario. Refer to Table 2 Likehood matrix, Table 3 Impact Scale and Table 4 Detection Difficulty Table for the qualitative measures. Calculate the risk value (FMEA).

c) Interface freeze takes 35% longer than expected due to bad design. It is hardly happen during the testing phase. Detection Probability is 15%.

QUESTION 4 Tabulate the risk event based on the

APPENDIX 5 4 Almost certain Likely Possible Unlikely Table 2 Qualitative measures of Like hood It is expected to occur at some time during the exercise Will probably occur in most circumstances Might occur at some time Could occur at some time May occur in exceptional circumstances 3 2 2 1 Rare Table 3 Impact Scale Project Objective Design 1 Very Low Insignificant design changes Quality Quality degradation barely noticeable 3 Low Moderate 40% design design changes changes Quality Project end reduction item is unacceptable effectively to sponsor useless 20-40% > 40% resources resources changes changes > 10 complaints complaints 20-40% cost > 40% cost increase increase Resources Insignificant resources changes No complaints Customer 6-9 Budget Insignificant cost increase 1 Remote 2 Low Table 4 Detection Difficulty Table Detection Probability

Step by Step Solution

There are 3 Steps involved in it

1 Expert Approved Answer
Step: 1 Unlock blur-text-image
Question Has Been Solved by an Expert!

Get step-by-step solutions from verified subject matter experts

Step: 2 Unlock
Step: 3 Unlock

Students Have Also Explored These Related General Management Questions!