

Question: Question 4 The data for question 4 is in the worksheet named PC Data .In January 1999, a PC industry analyst for one of
Question 4
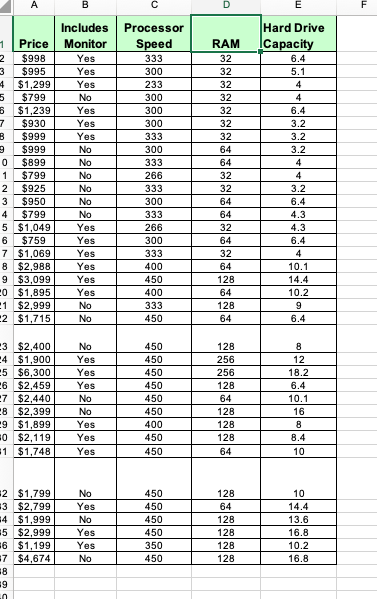
The data for question 4 is in the worksheet named "PC Data."In January 1999, a PC industry analyst for one of the major business publications was asked to prepare article on computer capability and price.One of the things she wished to ascertain was the relationship between PC cost and such factors as Ram, hard drive capacity, and processor speed.She collected data for a sample of 36 PCs on the market.Use the data provided in the "PC Data" worksheet to
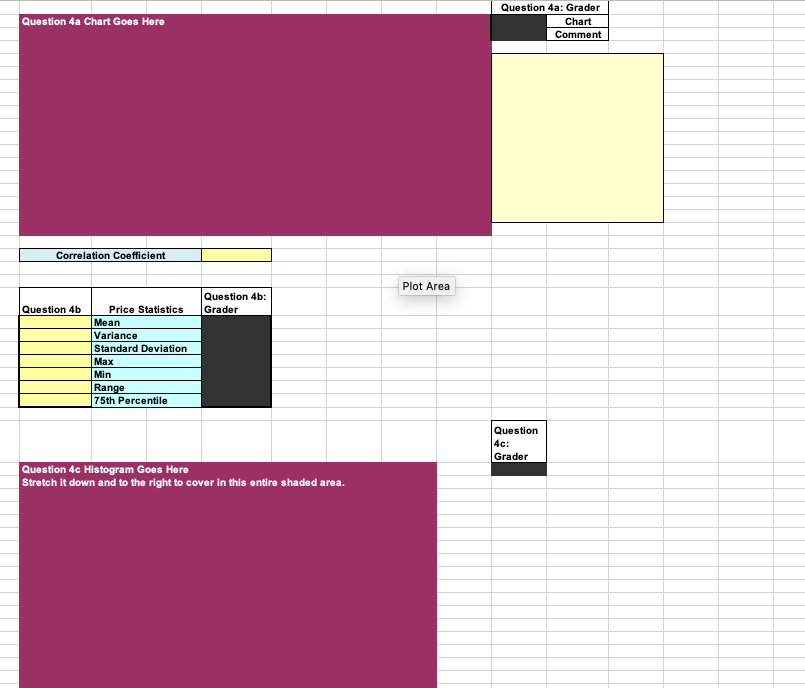
a.10 points: Construct an XY Scatter (chart subtype = scatter) Diagram displaying the relationship between Hard Drive Capacity and Price.
Chart Specifications
You should specify the "Hard Drive Capacity" for the X-values, and use the Price for the Y-values.Do not include the variable names in the range of "Hard Drive Capacity VS Price."
Label the x-axis "Hard Drive Capacity" and label the y-axis "Price."
Move the chart so that it starts in cell G2.Size the chart so that it fits the red shaded area.
Summary
In the text box that starts in cell O5, comment on the relationship, or lack thereof, between Hard Drive Capacity and Price that the Scatter Diagram revealed.Include the value and interpretation of the correlation coefficient.Calculate the value of the correlation coefficient in cell J20.
b.14 points: In cells G24:G30, calculate the indicated statistics summarizing the variable Price using Excel's built-in functions.
c.10 points:Using text materials, StatTools, supplemental handouts, and the Histogram Video, construct a professional histogram for the variable "Price."Place your histogram so that it starts in cell G33.Stretch it down and to the right to cover the entire shaded area.
A B D E F Includes Processor Hard Drive Price Monitor Speed RAM Capacity $998 Yes 333 32 $995 6.4 Yes 300 32 5.1 $1,299 Yes 233 32 4 $799 No 300 32 4 $1,239 Yes 300 32 6.4 $930 Yes 300 32 3.2 $999 Yes 333 32 3.2 $999 No 300 64 3.2 $899 No 333 64 4 $799 No 266 32 4 $925 No 333 32 $950 3.2 No 300 64 5.4 $799 No 333 64 $1,049 4.3 Yes 266 32 4.3 $759 Yes 300 64 6.4 $1,069 Yes 333 32 $2.988 Yes 4 400 64 10.1 $3,099 Yes 450 128 14.4 $1,895 Yes 400 64 10.2 $2.999 No 333 128 9 2 $1,715 No 450 64 6.4 3 $2,400 No 450 128 B $1,900 Yes 450 256 $6,300 12 Yes 450 256 18.2 $2.459 Yes 450 128 6.4 $2,440 No 450 64 10.1 B $2,399 No 450 128 16 $1,899 Yes 400 128 B $2,119 Yes 450 128 B.4 1 $1,748 Yes 450 64 10 2 $1,799 No 450 128 10 $2.799 Yes 450 64 14.4 $1,999 No 450 128 13.6 5 $2,999 Yes 450 128 16.8 $1,199 Yes 350 128 $4.674 10.2 No 450 128 16.8Question 4a: Grader Question 4a Chart Goes Here Chart Comment Correlation Coefficient Plot Area Question 4b Question 4b Price Statistics Grader Mean Variance Standard Deviation Max Min Range 75th Percentile Question 4c: Grader Question 4c Histogram Goes Here Stretch it down and to the right to cover in this entire shaded area
Step by Step Solution
There are 3 Steps involved in it

Get step-by-step solutions from verified subject matter experts