

Question: Question 4. The solution satisfying the initial condition V(0)=1 is: V(t)=(exp(t/6)2)3 Paste your code here: a=1;b=a/2symsV(t)ThisistheCODEFOR#4sol(1) Question 5: Plot the Tumor's Growth: If you stored
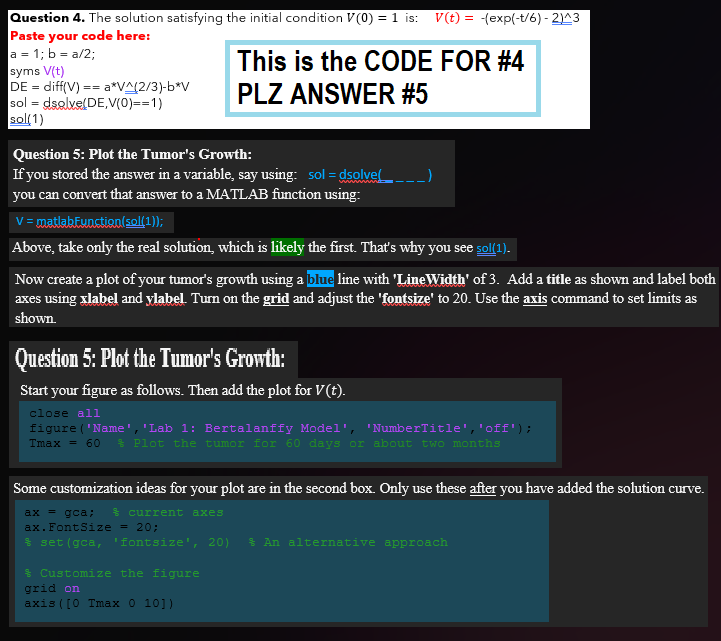
Question 4. The solution satisfying the initial condition V(0)=1 is: V(t)=(exp(t/6)2)3 Paste your code here: a=1;b=a/2symsV(t)ThisistheCODEFOR#4sol(1) Question 5: Plot the Tumor's Growth: If you stored the answer in a variable, say using: sol =d solve (.) you can convert that answer to a MATLAB function using: Above, take only the real solution, which is likely the first. That's why you see sol(1). Now create a plot of your tumor's growth using a blue line with 'LineWidth' of 3. Add a title as shown and label both axes using xlabel and ylabel. Turn on the grid and adjust the 'fontsize' to 20 . Use the axis command to set limits as shown. Question 5;: Plot the Tumor's Growth: Start your figure as follows. Then add the plot for V(t). closeallfigure(Name,Lab1:BertalanffyModel,NumberTitle,off);Tmax=60Plotthetumorfor60daysorabouttwomonths Some customization ideas for your plot are in the second box. Only use these after you have added the solution curve
Step by Step Solution
There are 3 Steps involved in it

Get step-by-step solutions from verified subject matter experts