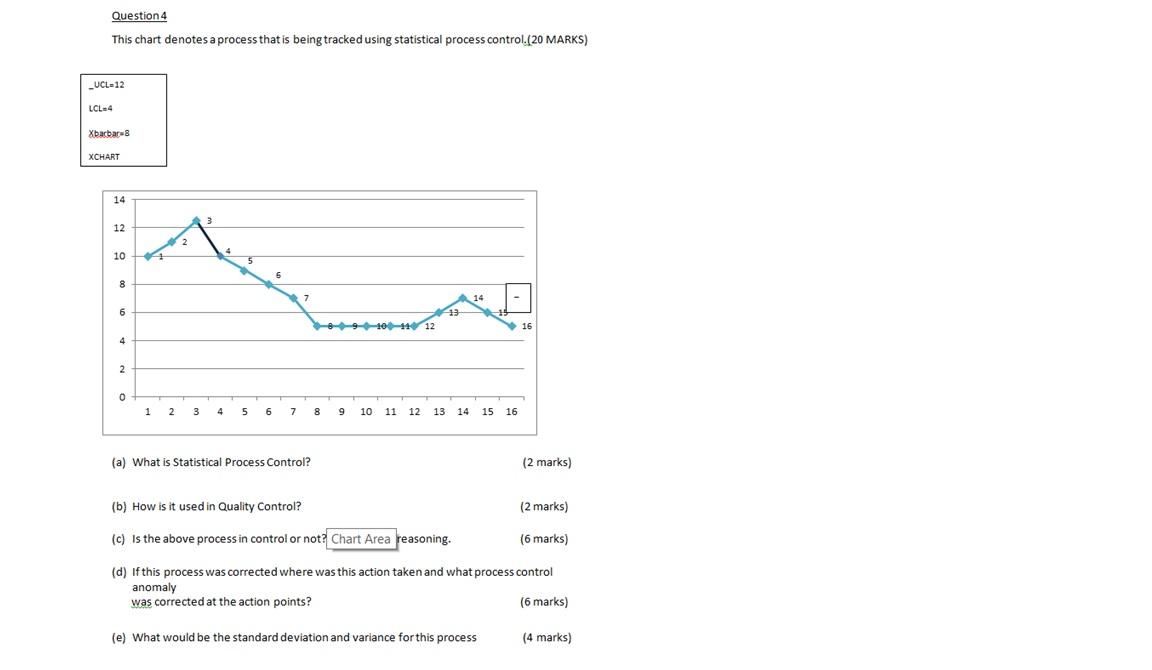
Question: Question 4 This chart denotes a process that is being tracked using statistical process control.(20 MARKS) _UCL-12 LCL 4 Xbacbar-8 XCHART 14 12 10 8

Question 4 This chart denotes a process that is

Question 4 This chart denotes a process that is being tracked using statistical process control.(20 MARKS) _UCL-12 LCL 4 Xbacbar-8 XCHART 14 12 10 8 6 10-12 16 4 2 0 1 2 3 4 5 6 7 8 9 10 11 12 13 14 15 16 (a) That is Statistical Process Control? marks) (b) How is it used in Quality Control? (2 marks) (c) Is the above process in control or not? Chart Area reasoning, (6 marks) (d) If this process was corrected where was this action taken and what process control anomaly was corrected at the action points? (6 marks) (e) What would be the standard deviation and variance for this process (4 marks)

Step by Step Solution

There are 3 Steps involved in it

1 Expert Approved Answer
Step: 1 Unlock blur-text-image
Question Has Been Solved by an Expert!

Get step-by-step solutions from verified subject matter experts

Step: 2 Unlock
Step: 3 Unlock

Students Have Also Explored These Related General Management Questions!