

Question: Question 40(Multiple Choice Worth 1 points) (02.08 MC) Use the graph to answer the question that follows. S2 Price SI Demand Quantity A per-unit tax
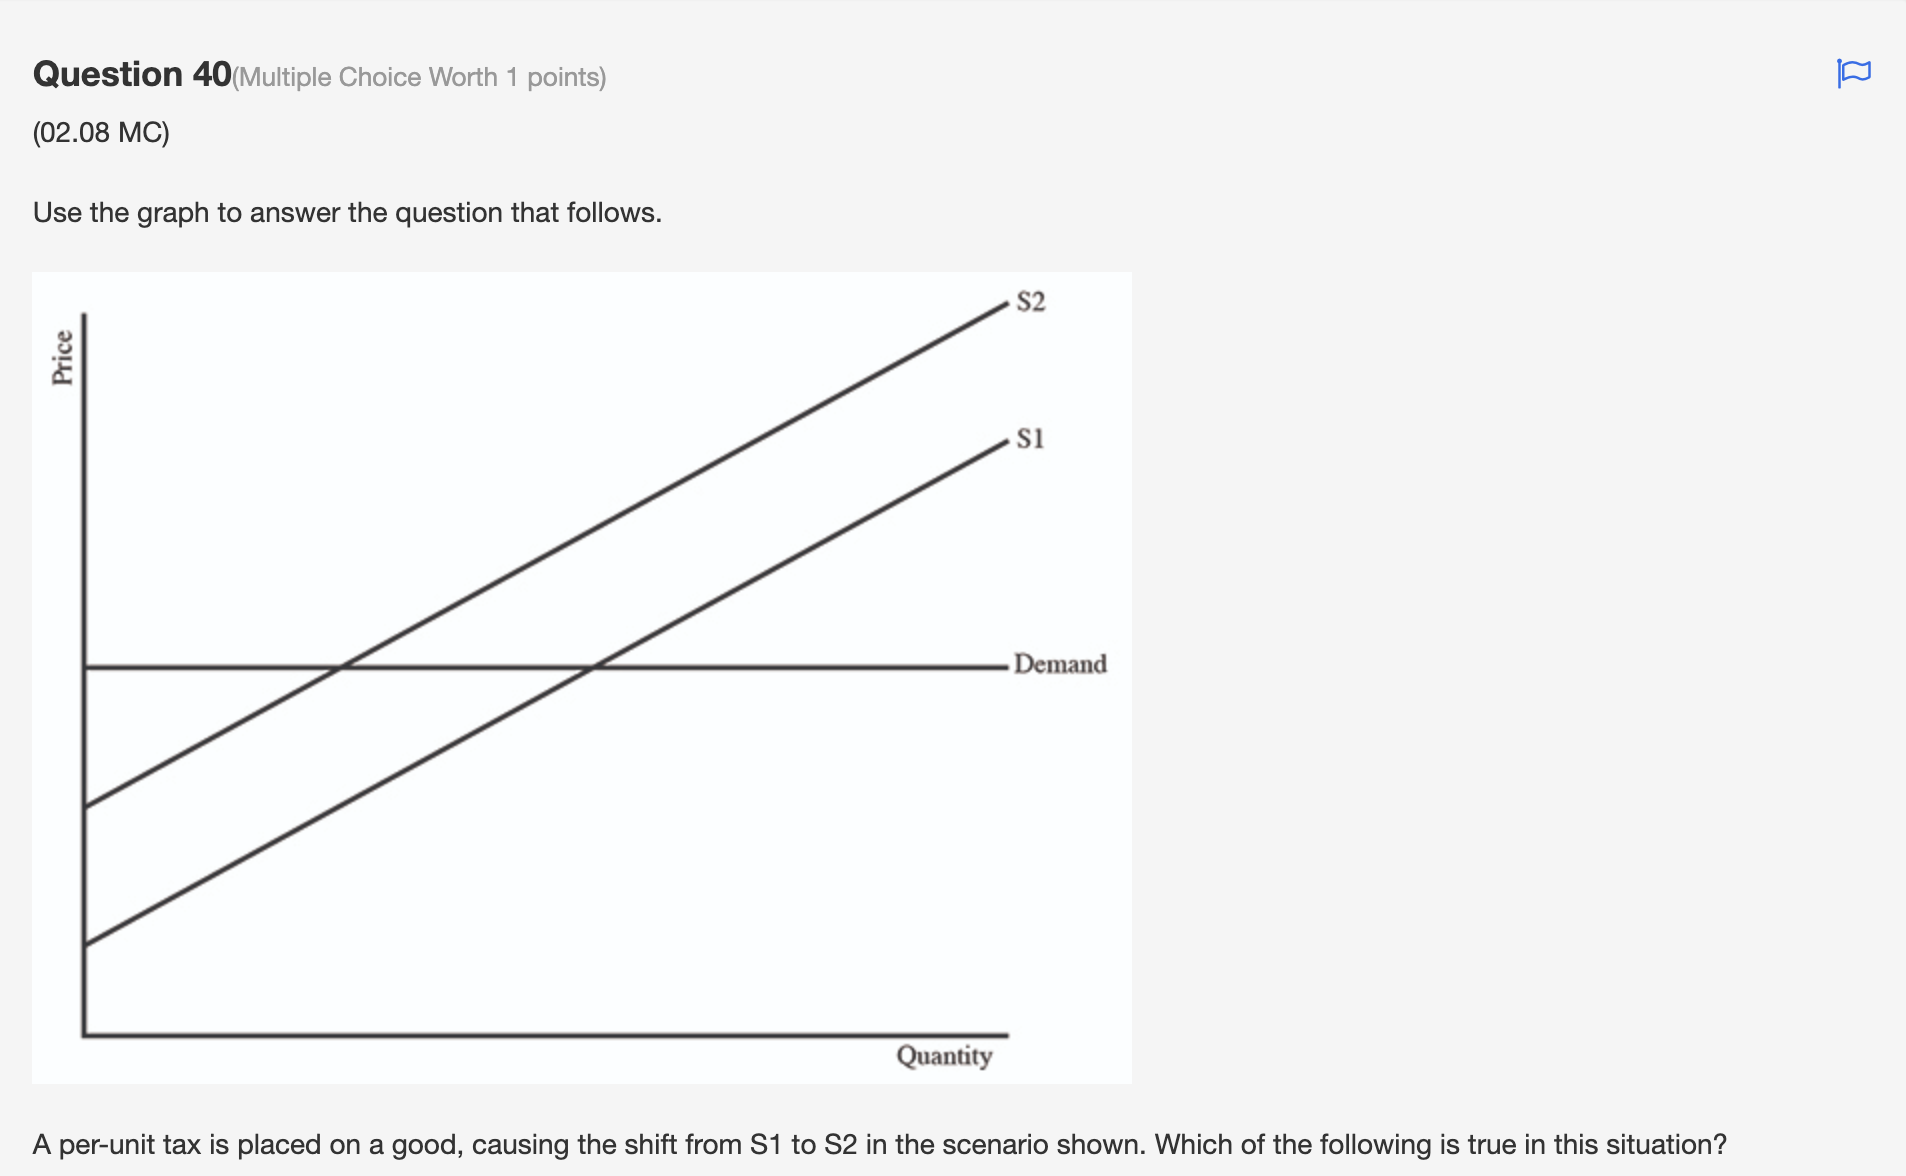

Question 40(Multiple Choice Worth 1 points) (02.08 MC) Use the graph to answer the question that follows. S2 Price SI Demand Quantity A per-unit tax is placed on a good, causing the shift from S1 to $2 in the scenario shown. Which of the following is true in this situation? [:3
Step by Step Solution
There are 3 Steps involved in it
1 Expert Approved Answer
Step: 1 Unlock

Question Has Been Solved by an Expert!
Get step-by-step solutions from verified subject matter experts
Step: 2 Unlock
Step: 3 Unlock