

Question: Question 4.2 . First, simulate 5000 bootstrap resamples of the positive review percentages. For each bootstrap resample, calculate the resample mean and store the resampled

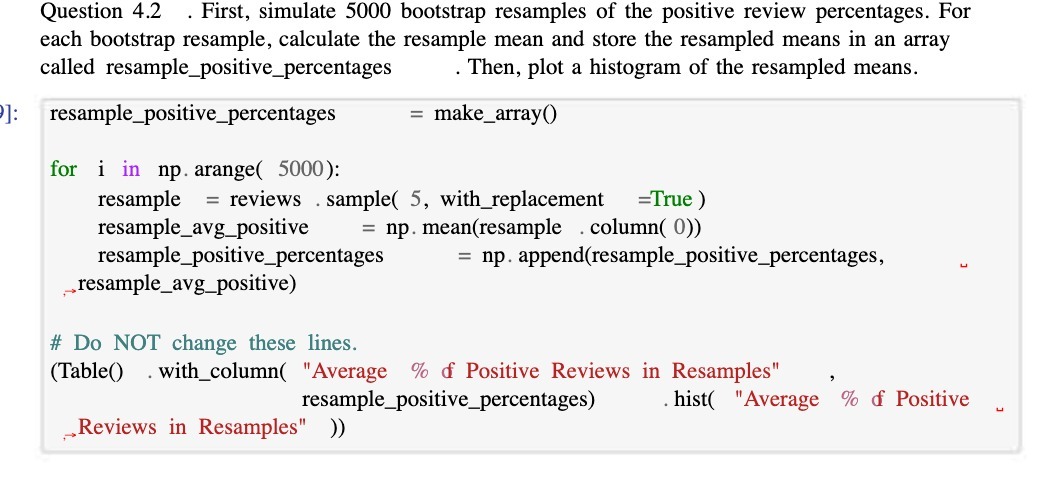
Question 4.2 . First, simulate 5000 bootstrap resamples of the positive review percentages. For each bootstrap resample, calculate the resample mean and store the resampled means in an array called resample_positive_percentages . Then, plot a histogram of the resampled means.: resample_positive_percentages = make_array() for i in np. arange( 5000): resample = reviews . sample( 5, with_replacement =True ) resample_avg_positive = np. mean(resample . column( 0)) resample_positive_percentages = np. append(resample_positive_percentages, L _resample_avg_positive) # Do NOT change these lines. (Table() . with_column( "Average % f Positive Reviews in Resamples" resample_positive_percentages) . hist( "Average % f Positive _ _Reviews in Resamples" ))
Step by Step Solution
There are 3 Steps involved in it

Get step-by-step solutions from verified subject matter experts