

Question: Question 5 (0.5 points) The graph below shows the derivative of the function y=f(x) on the interval x E [0, 8]. Suppose f(x) is continuous
![the function y=f(x) on the interval x E [0, 8]. Suppose f(x)](https://s3.amazonaws.com/si.experts.images/answers/2024/06/666636d77eb0f_743666636d764083.jpg)
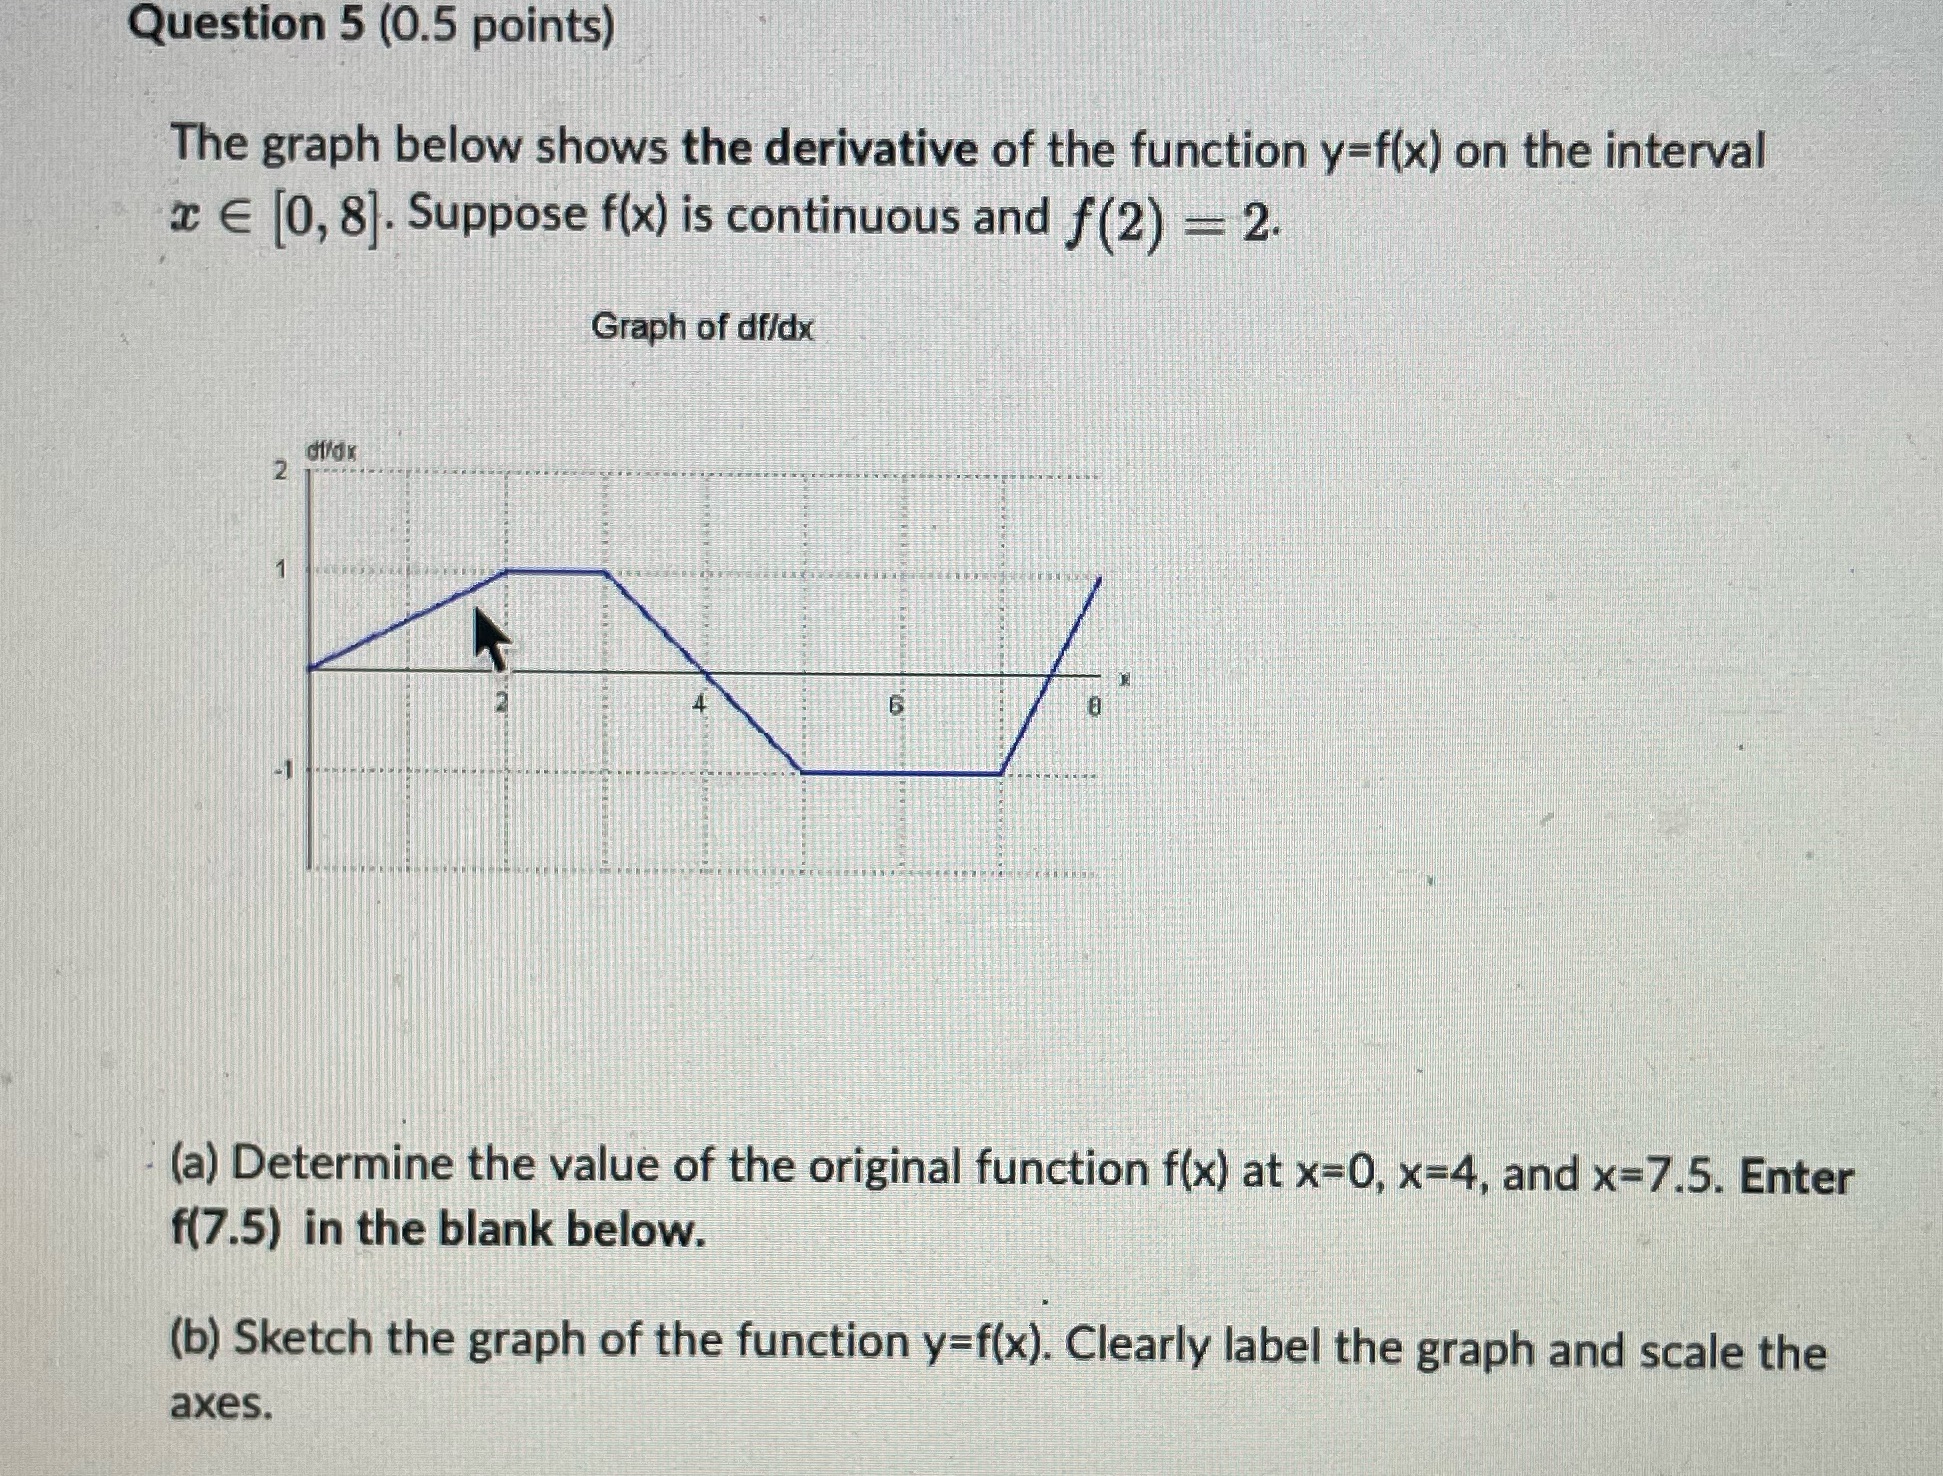
Question 5 (0.5 points) The graph below shows the derivative of the function y=f(x) on the interval x E [0, 8]. Suppose f(x) is continuous and f(2) = 2. Graph of df/dx CO. (a) Determine the value of the original function f(x) at x=0, x=4, and x=7.5. Enter f(7.5) in the blank below. (b) Sketch the graph of the function y=f(x). Clearly label the graph and scale the axes
Step by Step Solution
There are 3 Steps involved in it
1 Expert Approved Answer
Step: 1 Unlock

Question Has Been Solved by an Expert!
Get step-by-step solutions from verified subject matter experts
Step: 2 Unlock
Step: 3 Unlock