

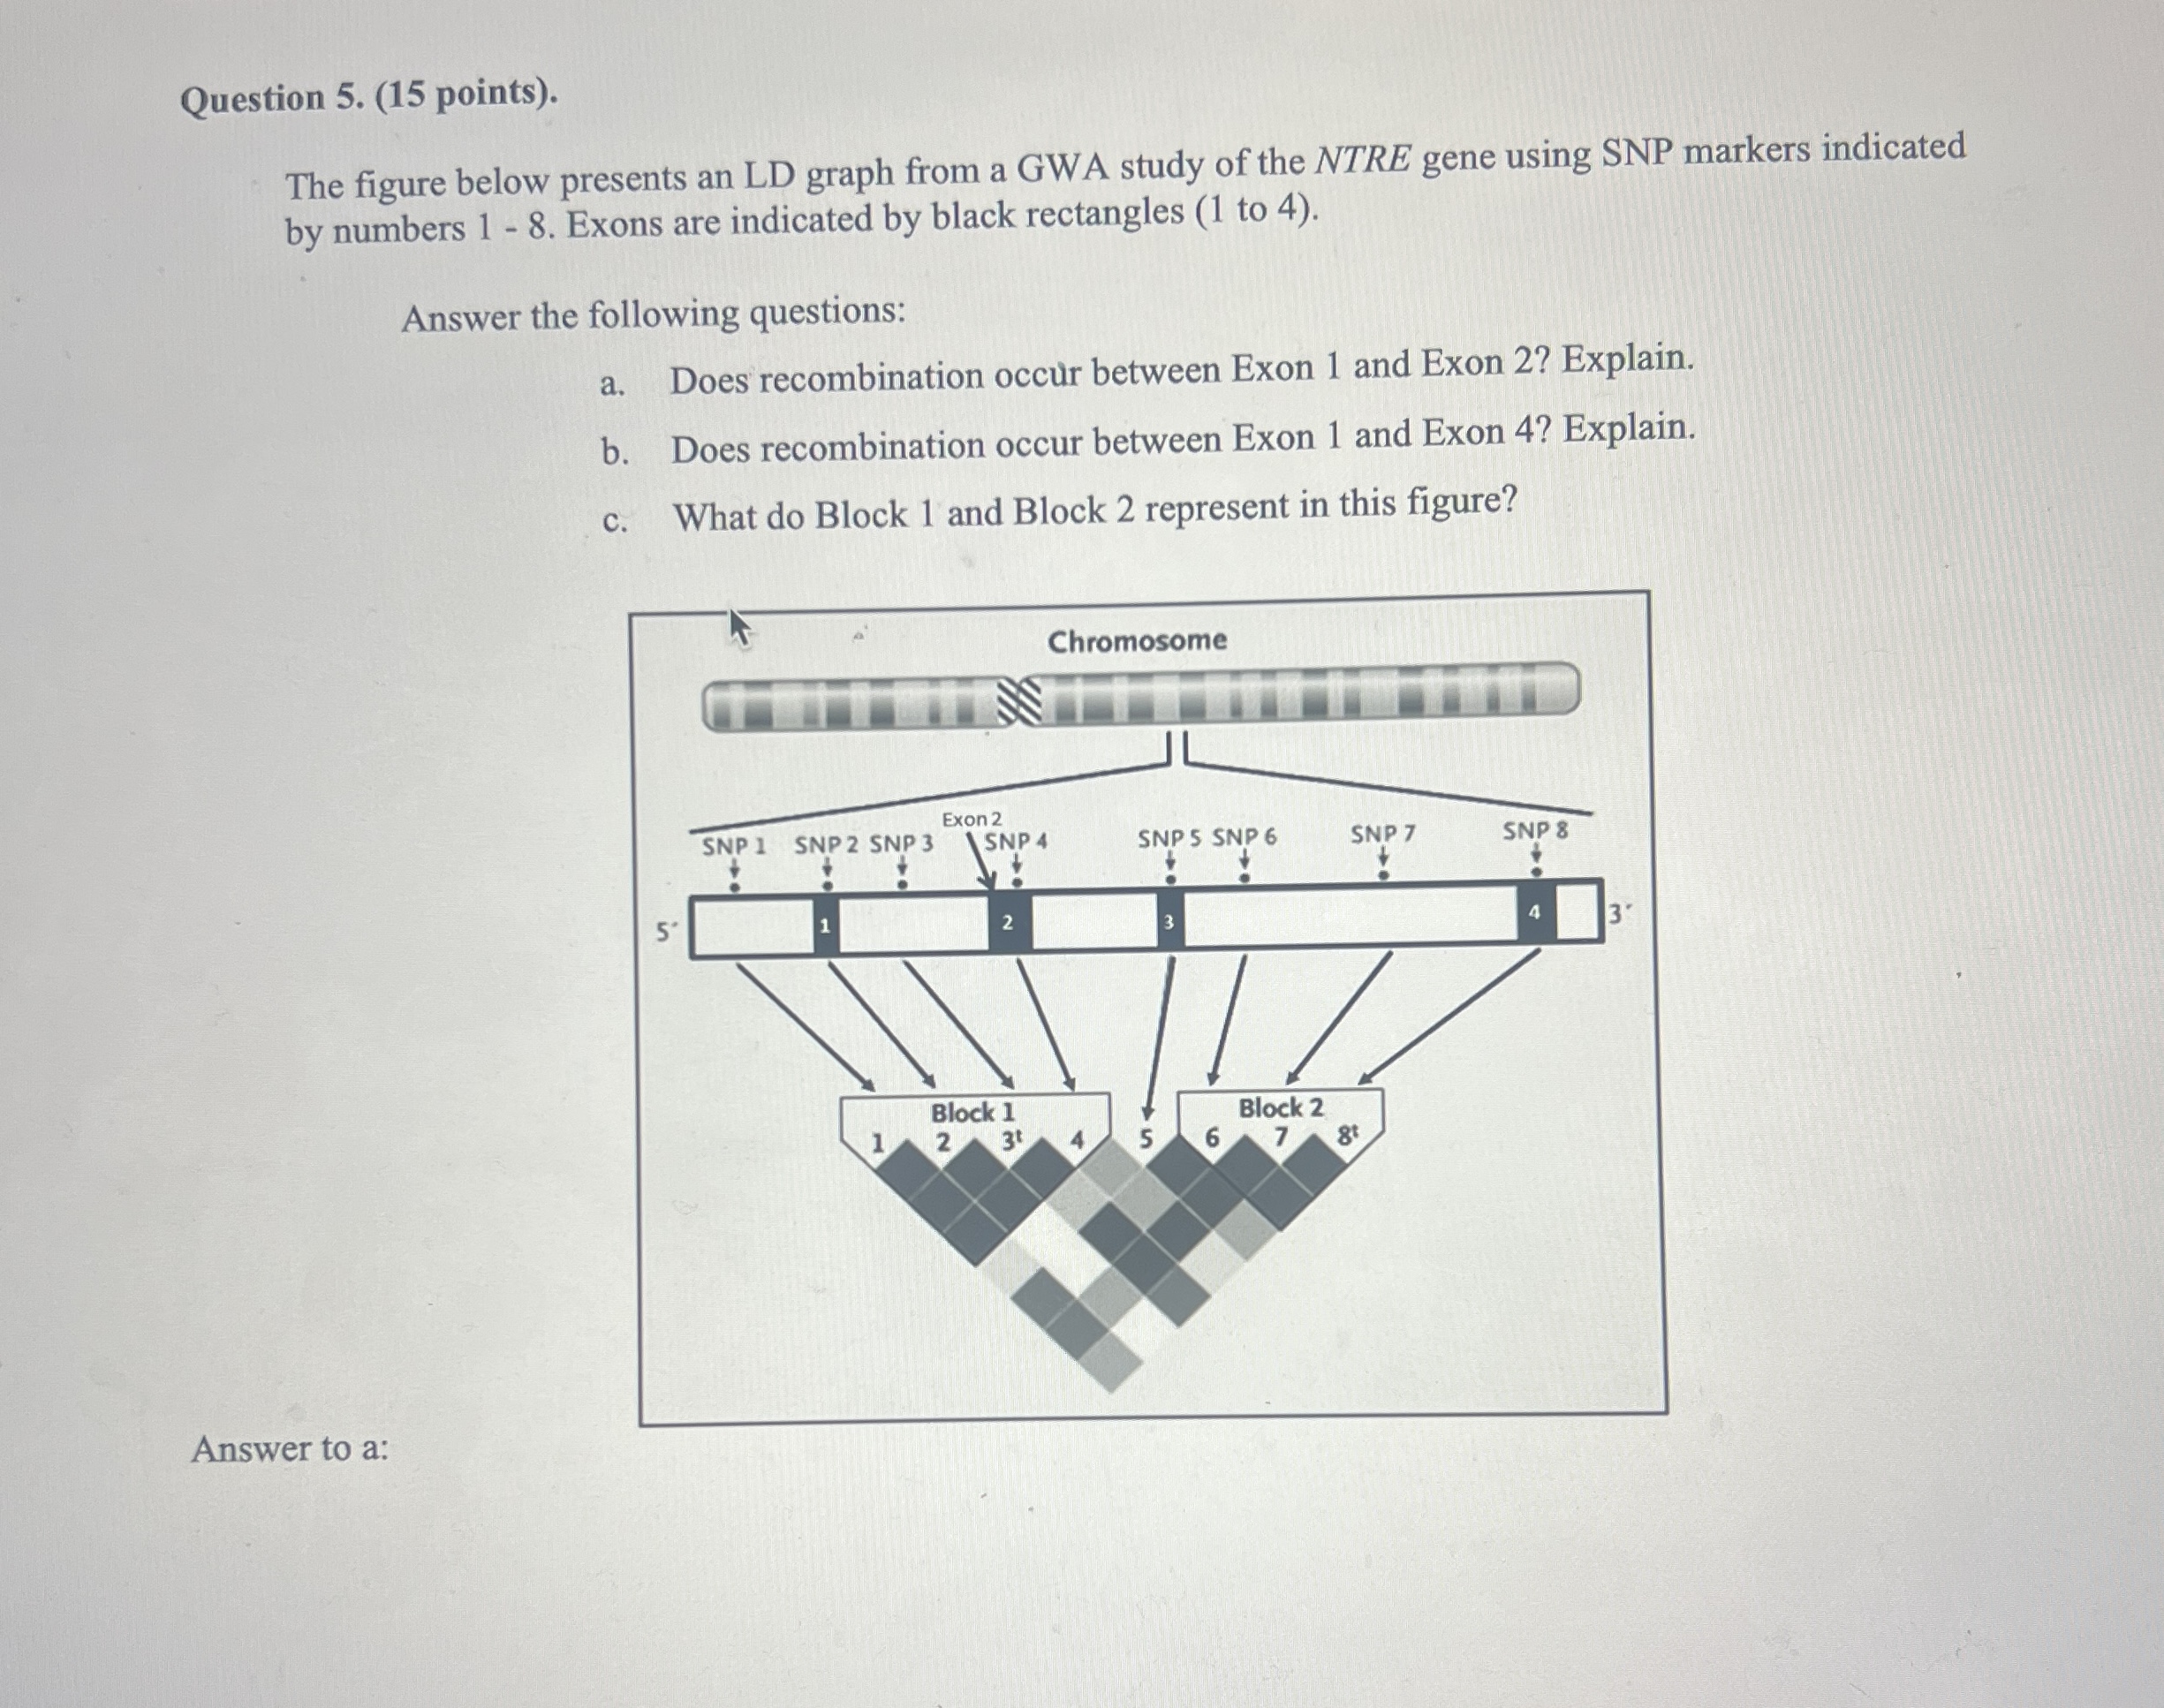
Question: Question 5 . ( 1 5 points ) . The figure below presents an LD graph from a GWA study of the NTRE gene using
Question points
The figure below presents an LD graph from a GWA study of the NTRE gene using SNP markers indicated by numbers Exons are indicated by black rectangles to
Answer the following questions:
a Does recombination occur between Exon and Exon Explain.
b Does recombination occur between Exon and Exon Explain.
c What do Block and Block represent in this figure?
Answer to a:
Step by Step Solution
There are 3 Steps involved in it
1 Expert Approved Answer
Step: 1 Unlock

Question Has Been Solved by an Expert!
Get step-by-step solutions from verified subject matter experts
Step: 2 Unlock
Step: 3 Unlock