

Question: Question 5 The following table shows summary data on mercury concentration in mackerel (in ppm) from two different areas of Atlantic Ocean. Area 1:
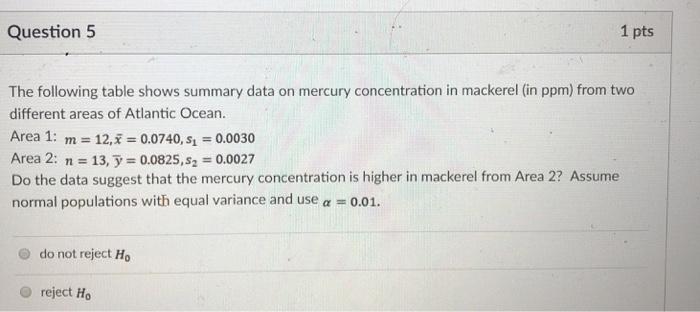
Question 5 The following table shows summary data on mercury concentration in mackerel (in ppm) from two different areas of Atlantic Ocean. Area 1: m = 12, x = 0.0740, s=0.0030 Area 2: n = 13, y = 0.0825, s = 0.0027 Do the data suggest that the mercury concentration is higher in mackerel from Area 2? Assume normal populations with equal variance and use a = 0.01. do not reject Ho 1 pts reject Ho
Step by Step Solution
★★★★★
3.55 Rating (152 Votes )
There are 3 Steps involved in it
1 Expert Approved Answer
Step: 1 Unlock

ANS WER O do not reject Ho EX ... View full answer
Question Has Been Solved by an Expert!
Get step-by-step solutions from verified subject matter experts
Step: 2 Unlock
Step: 3 Unlock