

Question: Question 5 --/1 View Policies Current Attempt in Progress Sheridan Company has these comparative balance sheet data: SHERIDAN COMPANY Balance Sheets December 31 2022 2021
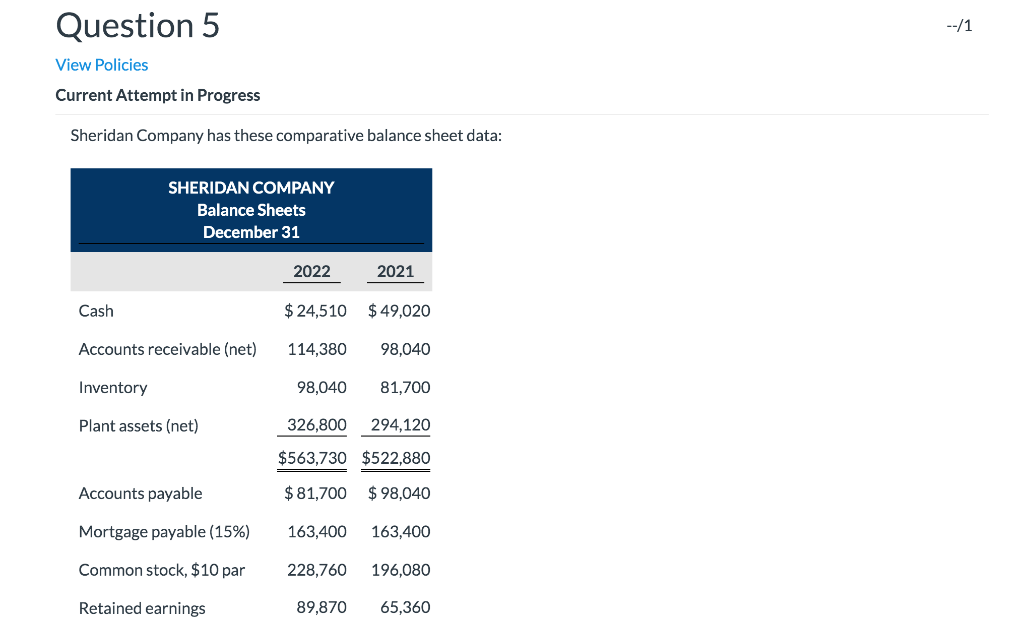
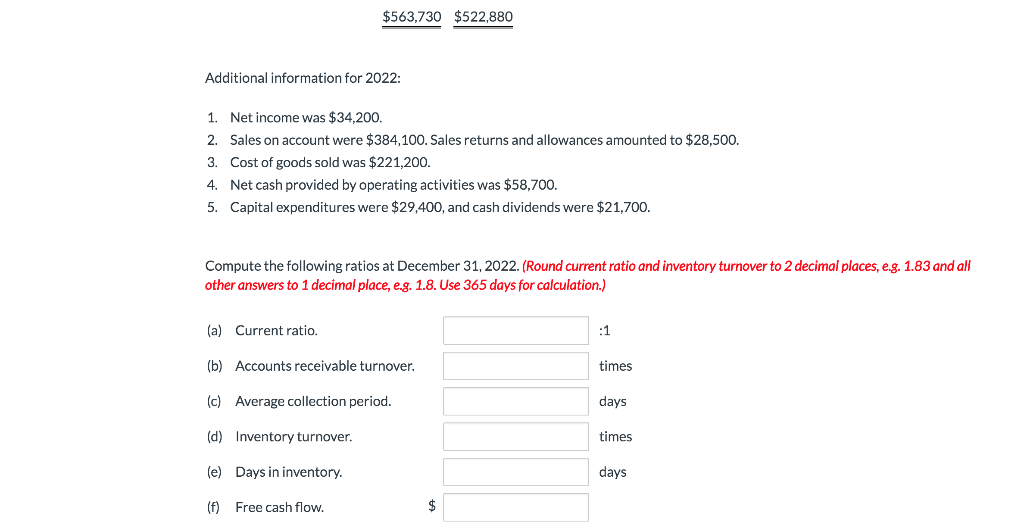
Question 5 --/1 View Policies Current Attempt in Progress Sheridan Company has these comparative balance sheet data: SHERIDAN COMPANY Balance Sheets December 31 2022 2021 Cash $ 24,510 $ 49,020 Accounts receivable (net) 114,380 98,040 Inventory 98,040 81,700 Plant assets (net) 326,800 294,120 $563,730 $522,880 $81,700 $98,040 Accounts payable Mortgage payable (15%) 163,400 163,400 Common stock, $10 par 228,760 89,870 196,080 65,360 Retained earnings $563,730 $522,880 Additional information for 2022: 1. Net income was $34,200. 2. Sales on account were $384,100. Sales returns and allowances amounted to $28,500. 3. Cost of goods sold was $221,200. 4. Net cash provided by operating activities was $58,700. 5. Capital expenditures were $29,400, and cash dividends were $21,700. Compute the following ratios at December 31, 2022. (Round current ratio and inventory turnover to 2 decimal places, e.g. 1.83 and all other answers to 1 decimal place, e.g. 1.8. Use 365 days for calculation.) (a) Current ratio. (b) Accounts receivable turnover. times (c) Average collection period. days (d) Inventory turnover. times le) Days in inventory. days (f) Free cash flow
Step by Step Solution
There are 3 Steps involved in it

Get step-by-step solutions from verified subject matter experts