

Question: Question 5 15 pts A recent study that examined bone strength from subjects in three age groups. The data are below. Does mean bone strength
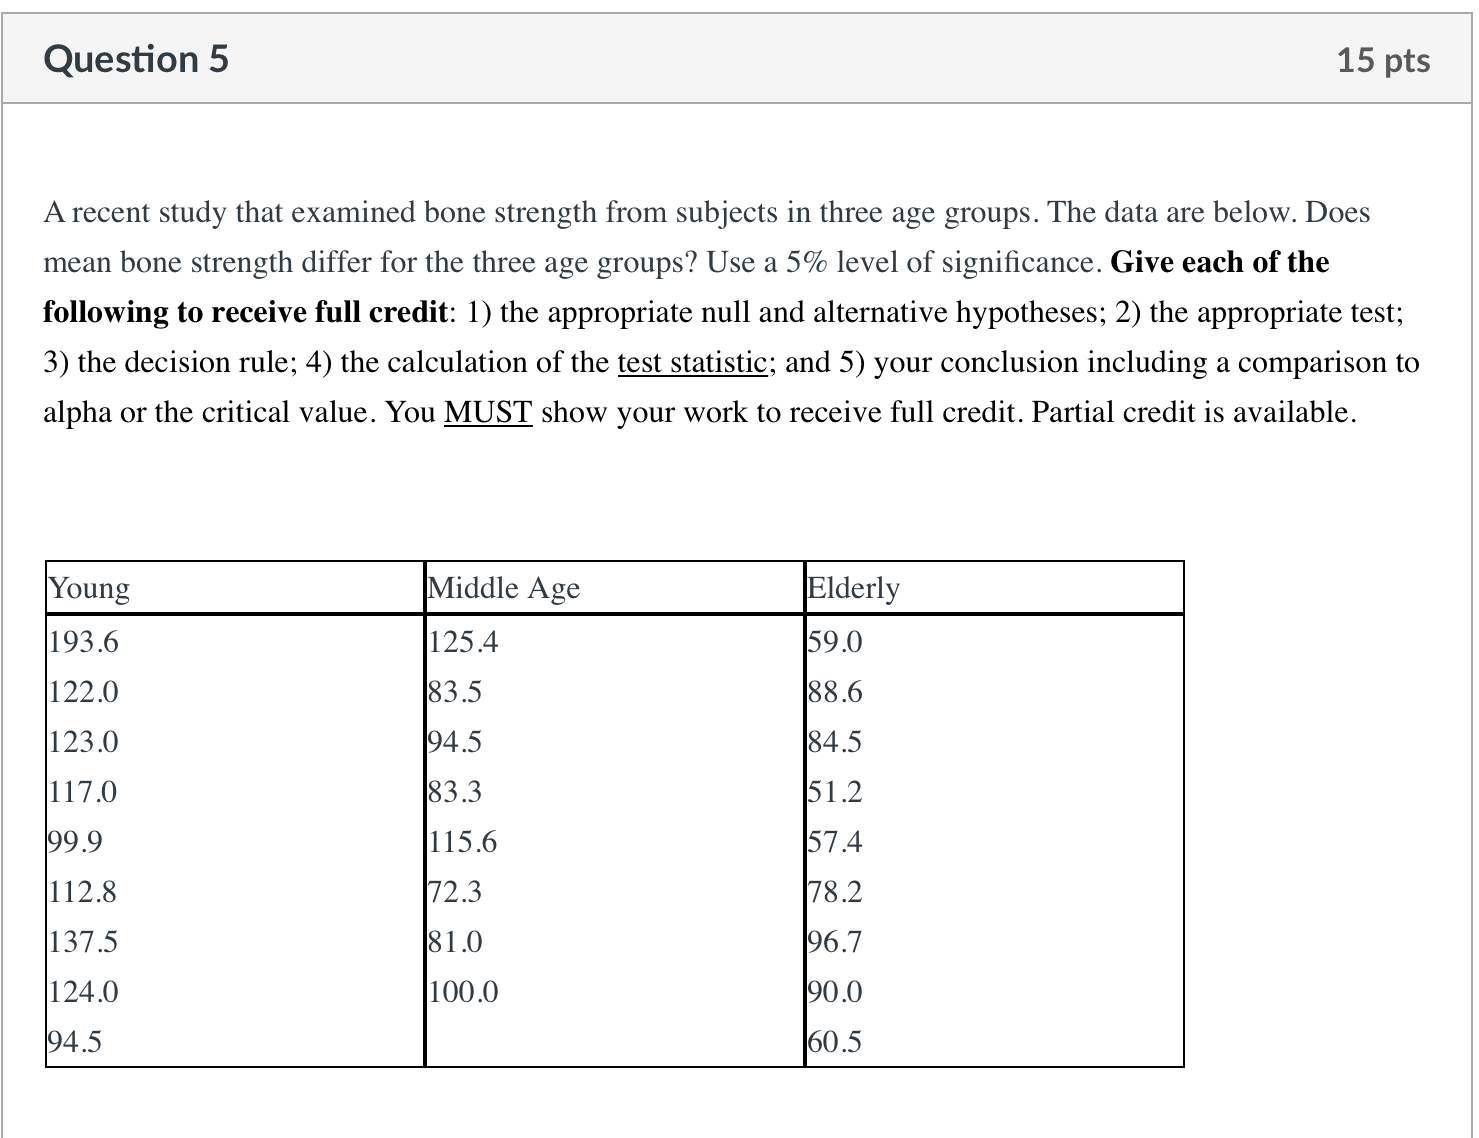
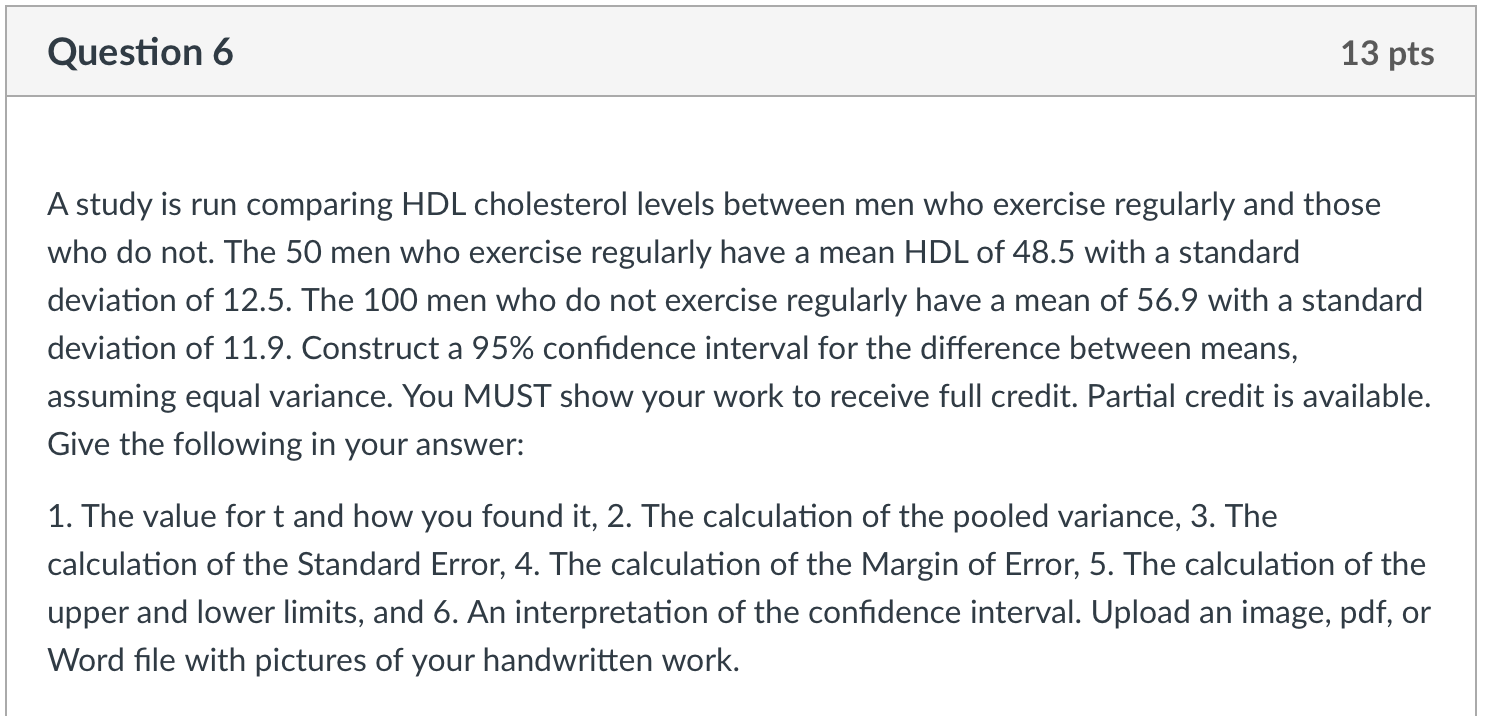
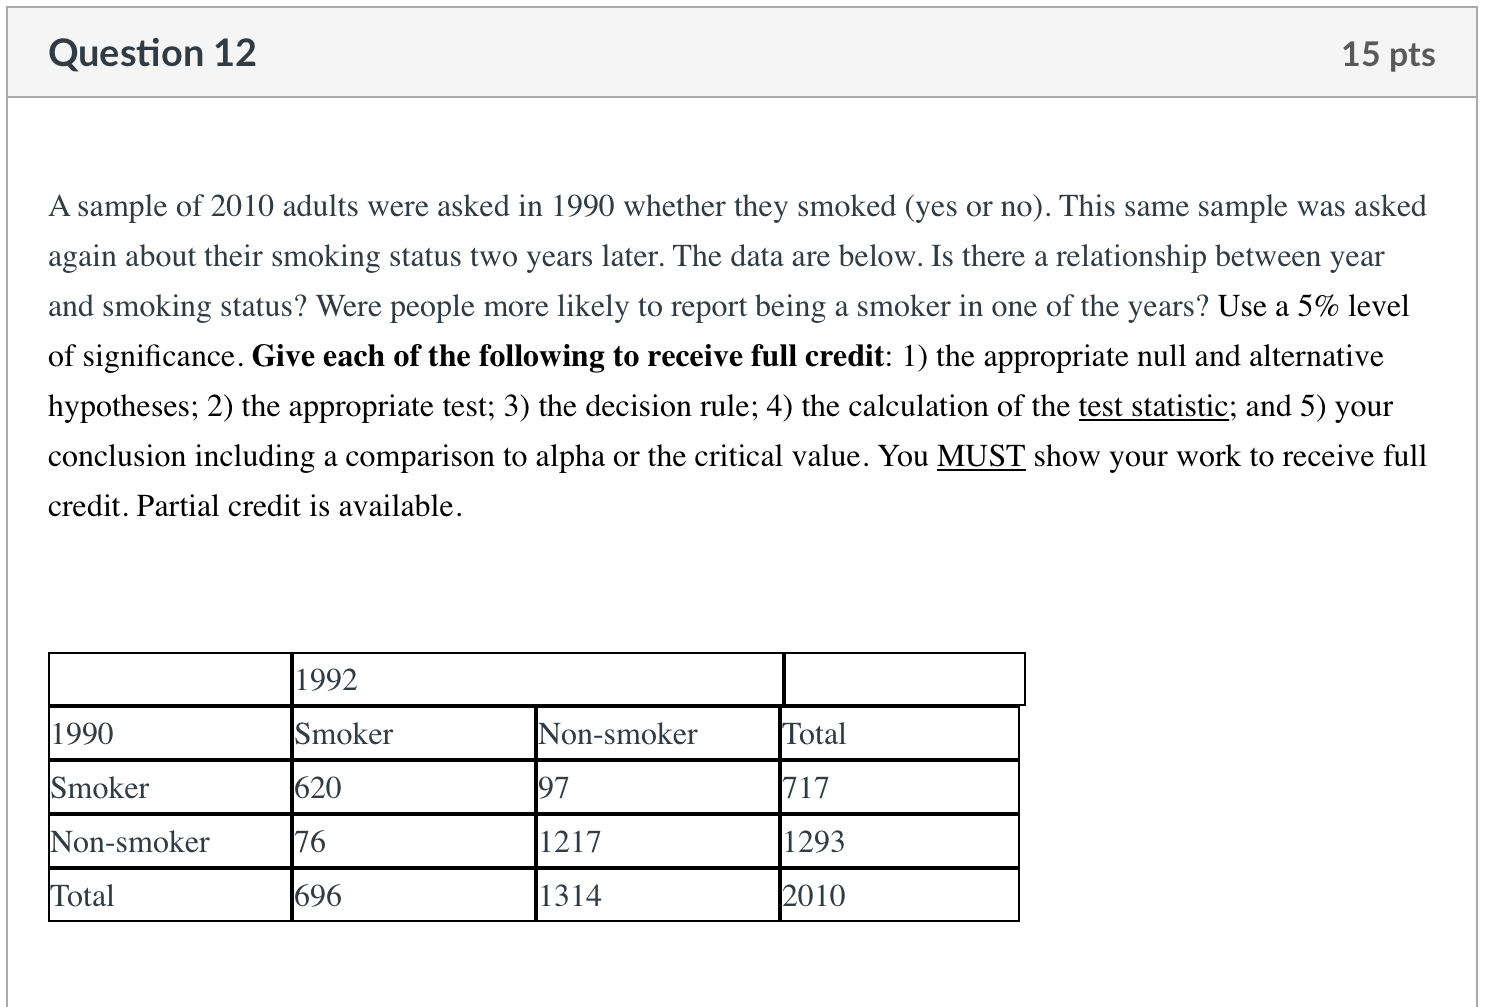
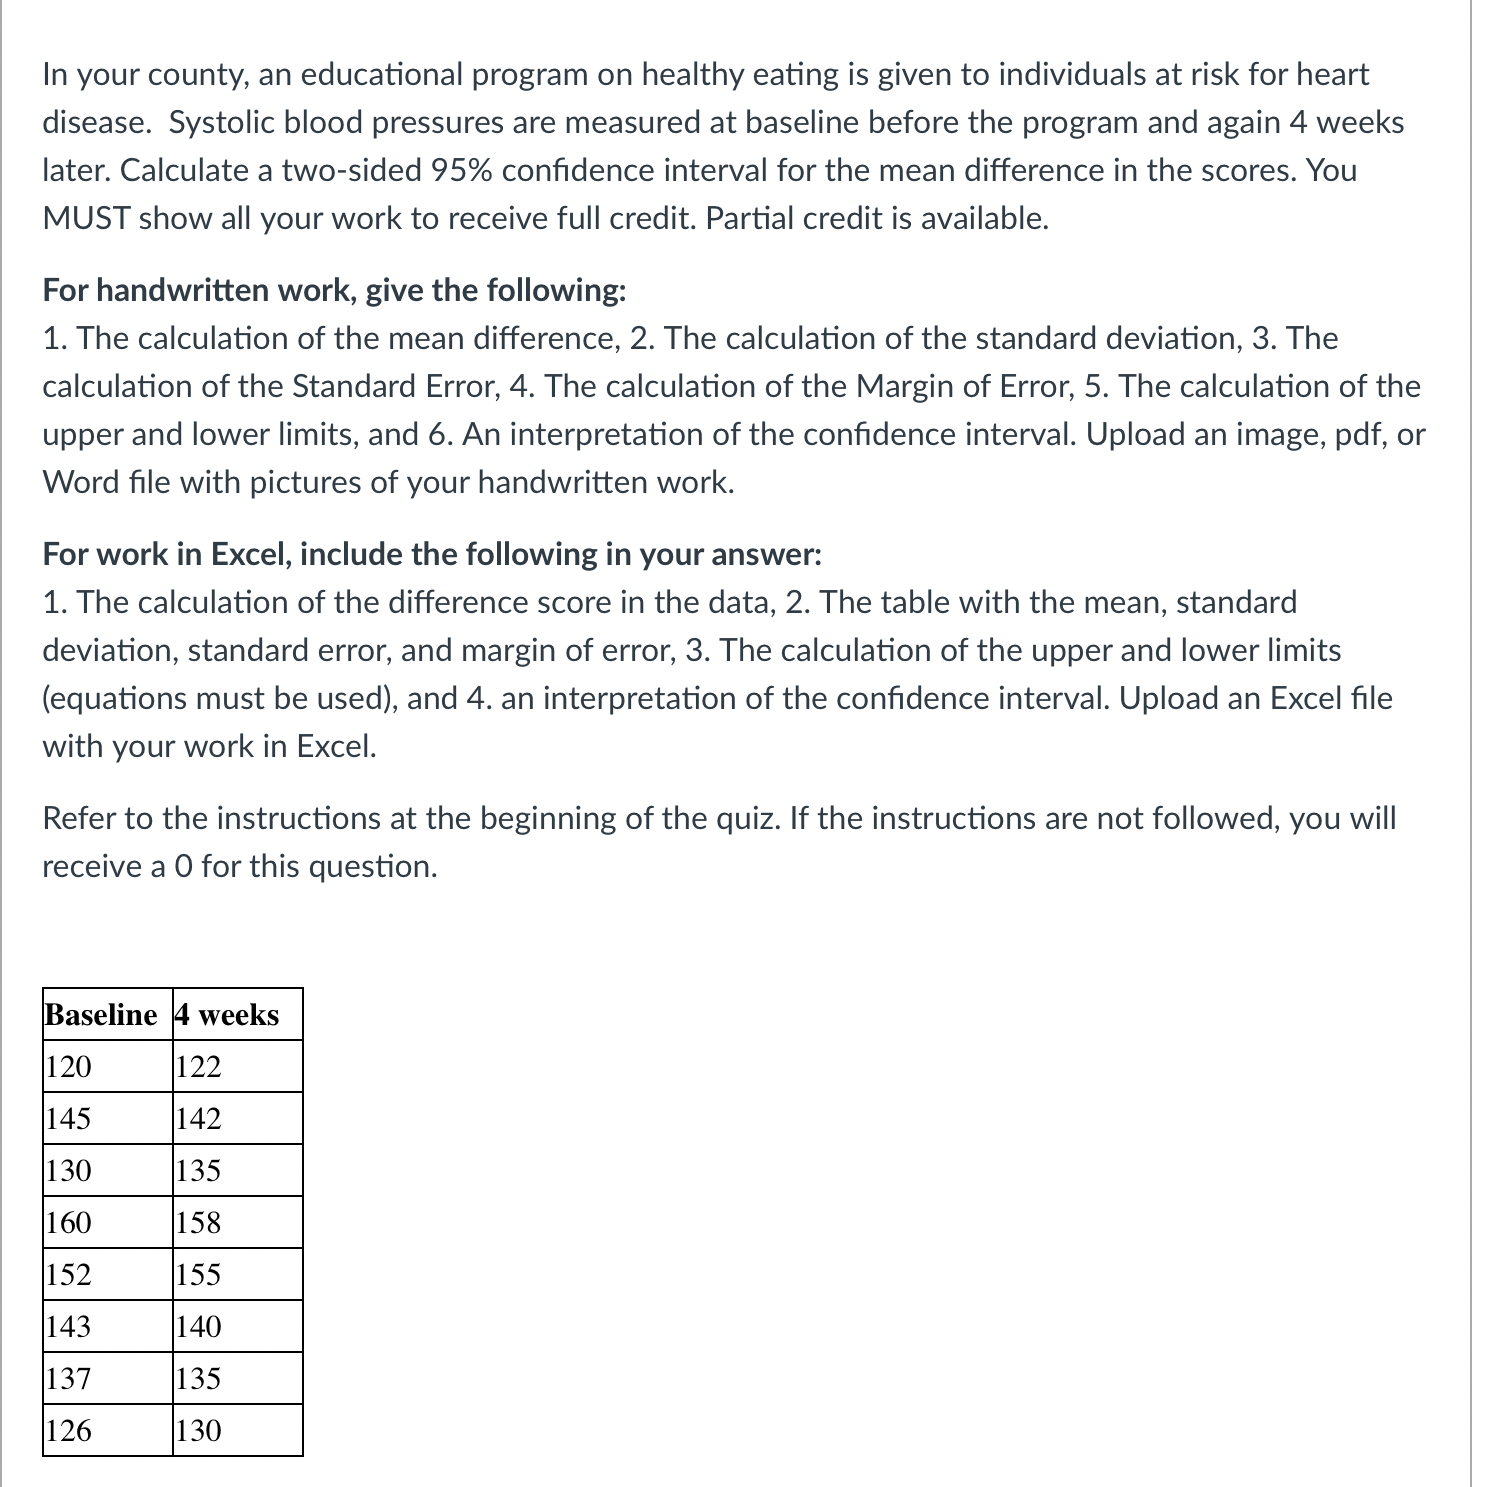
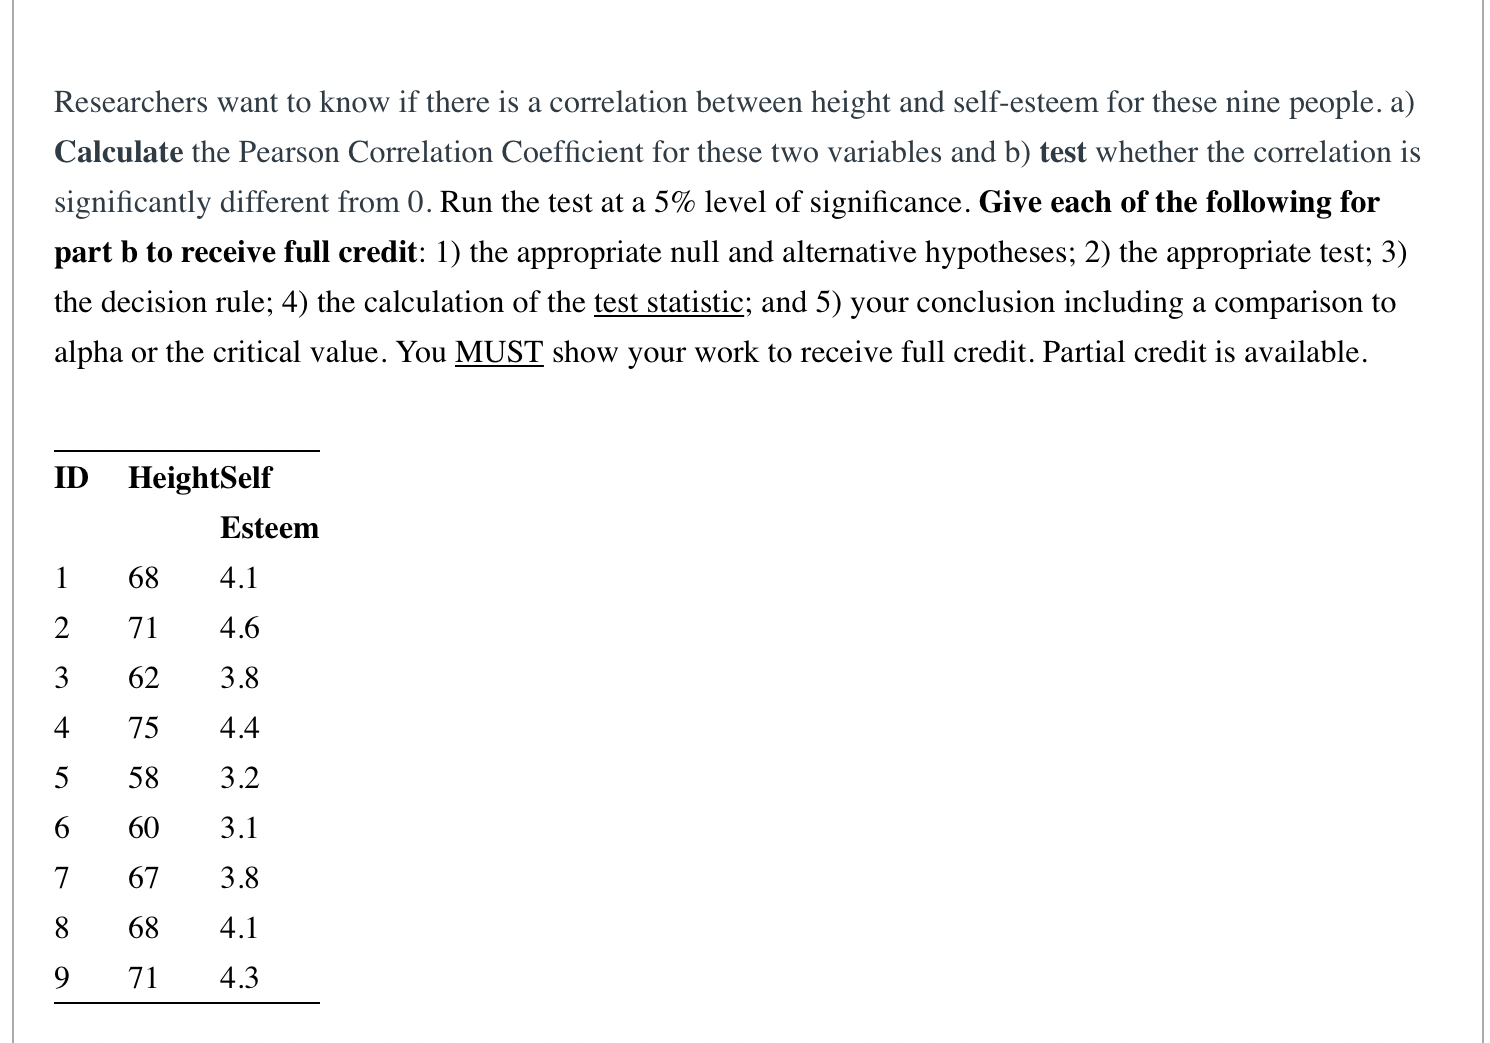
Question 5 15 pts A recent study that examined bone strength from subjects in three age groups. The data are below. Does mean bone strength differ for the three age groups? Use a 5% level of signicance. Give each of the following to receive full credit: 1) the appropriate null and alternative hypotheses; 2) the appropriate test; 3) the decision rule; 4) the calculation of the test statistic; and 5) your conclusion including a comparison to alpha or the critical value. You MUST show your work to receive full credit. Partial credit is available. Question 6 13 pts A study is run comparing HDL cholesterol levels between men who exercise regularly and those who do not. The 50 men who exercise regularly have a mean HDL of 48.5 with a standard deviation of 12.5. The 100 men who do not exercise regularly have a mean of 56.9 with a standard deviation of 11.9. Construct a 95% condence interval for the difference between means, assuming equal variance. You MUST show your work to receive full credit. Partial credit is available. Give the following in your answer: 1. The value fort and how you found it, 2. The calculation of the pooled variance, 3. The calculation of the Standard Error, 4. The calculation of the Margin of Error, 5. The calculation of the upper and lower limits, and 6. An interpretation of the condence interval. Upload an image, pdf, or Word le with pictures of your handwritten work. Question 12 15 pts A sample of 2010 adults were asked in 1990 whether they smoked (yes or no). This same sample was asked again about their smoking status two years later. The data are below. Is there a relationship between year and smoking status? Were people more likely to report being a smoker in one of the years? Use a 5% level of signicance. Give each of the following to receive full credit: 1) the appropriate null and alternative hypotheses; 2) the appropriate test; 3) the decision rule; 4) the calculation of the test statistic; and 5) your conclusion including a comparison to alpha or the critical value. You MU_ST show your work to receive full credit. Partial credit is available. In your county, an educational program on healthy eating is given to individuals at risk for heart disease. Systolic blood pressures are measured at baseline before the program and again 4 weeks later. Calculate a two-sided 95% condence interval for the mean difference in the scores. You MUST show all your work to receive full credit. Partial credit is available. For handwritten work, give the following: 1. The calculation of the mean difference, 2. The calculation of the standard deviation, 3. The calculation of the Standard Error, 4. The calculation of the Margin of Error, 5. The calculation of the upper and lower limits, and 6. An interpretation of the condence interval. Upload an image, pdf, or Word le with pictures of your handwritten work. For work in Excel, include the following in your answer: 1. The calculation of the difference score in the data, 2. The table with the mean, standard deviation, standard error, and margin of error, 3. The calculation of the upper and lower limits (equations must be used), and 4. an interpretation of the condence interval. Upload an Excel le with your work in Excel. Refer to the instructions at the beginning of the quiz. If the instructions are not followed, you will receive a 0 for this question. Researchers want to know if there is a correlation between height and self-esteem for these nine people. a) Calculate the Pearson Correlation Coefficient for these two variables and b) test whether the correlation is significantly different from 0. Run the test at a 5% level of significance. Give each of the following for part b to receive full credit: 1) the appropriate null and alternative hypotheses; 2) the appropriate test; 3) the decision rule; 4) the calculation of the test statistic; and 5) your conclusion including a comparison to alpha or the critical value. You MUST show your work to receive full credit. Partial credit is available. ID HeightSelf Esteem 1 68 4.1 2 71 4.6 3 62 3.8 4 75 4.4 U 58 3.2 6 60 3.1 67 3.8 8 68 4.1 9 71 4.3
Step by Step Solution
There are 3 Steps involved in it

Get step-by-step solutions from verified subject matter experts