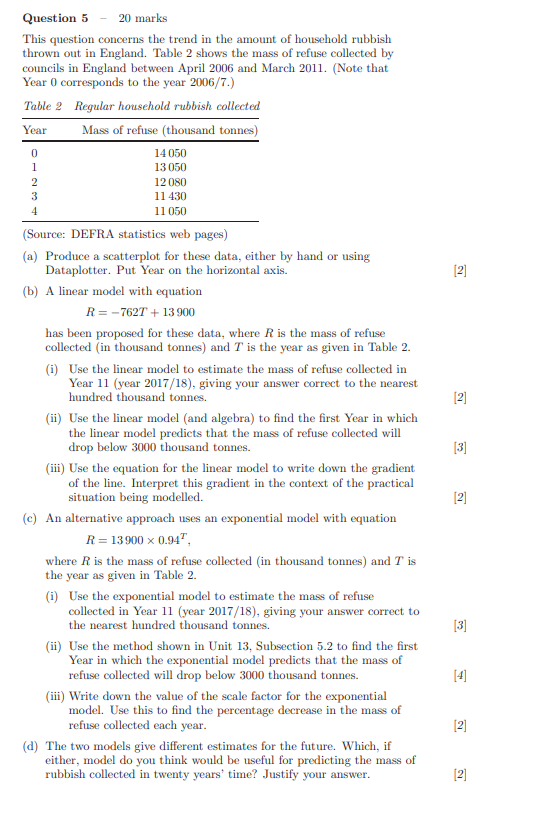
Question: Question 5 - 20 marks This question concerns the trend in the amount of household rubbish thrown out in England. Table 2 shows the mass

Question 5 - 20 marks This question concerns the
Question 5 - 20 marks This question concerns the trend in the amount of household rubbish thrown out in England. Table 2 shows the mass of refuse collected by councils in England between April 2006 and March 2011. (Note that Year 0 corresponds to the year 2006/7.) Table 2 Regular household rubbish collected Year Mass of refuse (thousand tonnes) 14050 13 050 12 080 11 430 11 050 Source: DEFRA statistics web pages) (a) Produce a scatterplot for these data, either by hand or using Dataplotter. Put Year on the horizontal axis. [2] (b) A linear model with equation R = -7627 + 13 900 has been proposed for these data, where R is the mass of refuse collected (in thousand tonnes) and T is the year as given in Table 2. (i) Use the linear model to estimate the mass of refuse collected in Year 11 (year 2017/18), giving your answer correct to the nearest hundred thousand tonnes. [2] (ii) Use the linear model (and algebra) to find the first Year in which the linear model predicts that the mass of refuse collected will drop below 3000 thousand tonnes. [3] (iii) Use the equation for the linear model to write down the gradient of the line. Interpret this gradient in the context of the practical situation being modelled. [2] (c) An alternative approach uses an exponential model with equation R = 13900 x 0.947 where R is the mass of refuse collected (in thousand tonnes) and T is the year as given in Table 2. (i) Use the exponential model to estimate the mass of refuse collected in Year 11 (year 2017/18), giving your answer correct to the nearest hundred thousand tonnes. [3] (ii) Use the method shown in Unit 13, Subsection 5.2 to find the first Year in which the exponential model predicts that the mass of refuse collected will drop below 3000 thousand tonnes. [4] (iii) Write down the value of the scale factor for the exponential model. Use this to find the percentage decrease in the mass of refuse collected each year. [2] (d) The two models give different estimates for the future. Which, if either, model do you think would be useful for predicting the mass of rubbish collected in twenty years' time? Justify your answer. [2]

Step by Step Solution

There are 3 Steps involved in it

1 Expert Approved Answer
Step: 1 Unlock blur-text-image
Question Has Been Solved by an Expert!

Get step-by-step solutions from verified subject matter experts

Step: 2 Unlock
Step: 3 Unlock

Students Have Also Explored These Related Mathematics Questions!