

Question: Question 5 [20 marks] You are given the following data for John Smith & Co. for two successive periods. July August Materials Labour Overheads Production
![Question 5 [20 marks] You are given the following data for](https://dsd5zvtm8ll6.cloudfront.net/si.experts.images/questions/2024/09/66ea9acbedeba_08366ea9acb5f514.jpg)
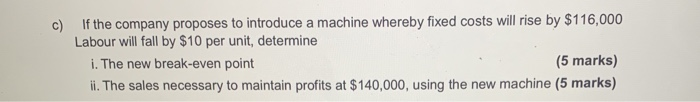
Question 5 [20 marks] You are given the following data for John Smith & Co. for two successive periods. July August Materials Labour Overheads Production levels $300,000 $212,000 $418,000 10,000 units $360,000 $247.000 $453,000 12,000 units All production is sold for $100 per unit a) b) Determine the break-even point for John Smith & Co. Prepare a chart in Excel that depicts the break-even point (4 marks) (6 marks) Provide an EXCEL graph detailing the necessary information to show the break-even points contained in your responses to parts (b) of this question. The graph must illustrate the B.E.P. and the region corresponding to profits and the region corresponding to Inceae Vauv a c) If the company proposes to introduce a machine whereby fixed costs will rise by $116,000 Labour will fall by $10 per unit, determine i. The new break-even point (5 marks) ii. The sales necessary to maintain profits at $140,000, using the new machine
Step by Step Solution
There are 3 Steps involved in it

Get step-by-step solutions from verified subject matter experts