

Question: Question 5 Question 5 Calculate the mean of the data set represent via the distribution below. Class Midpoints Frequency 11 13 21 25 29 Mean

Question 5
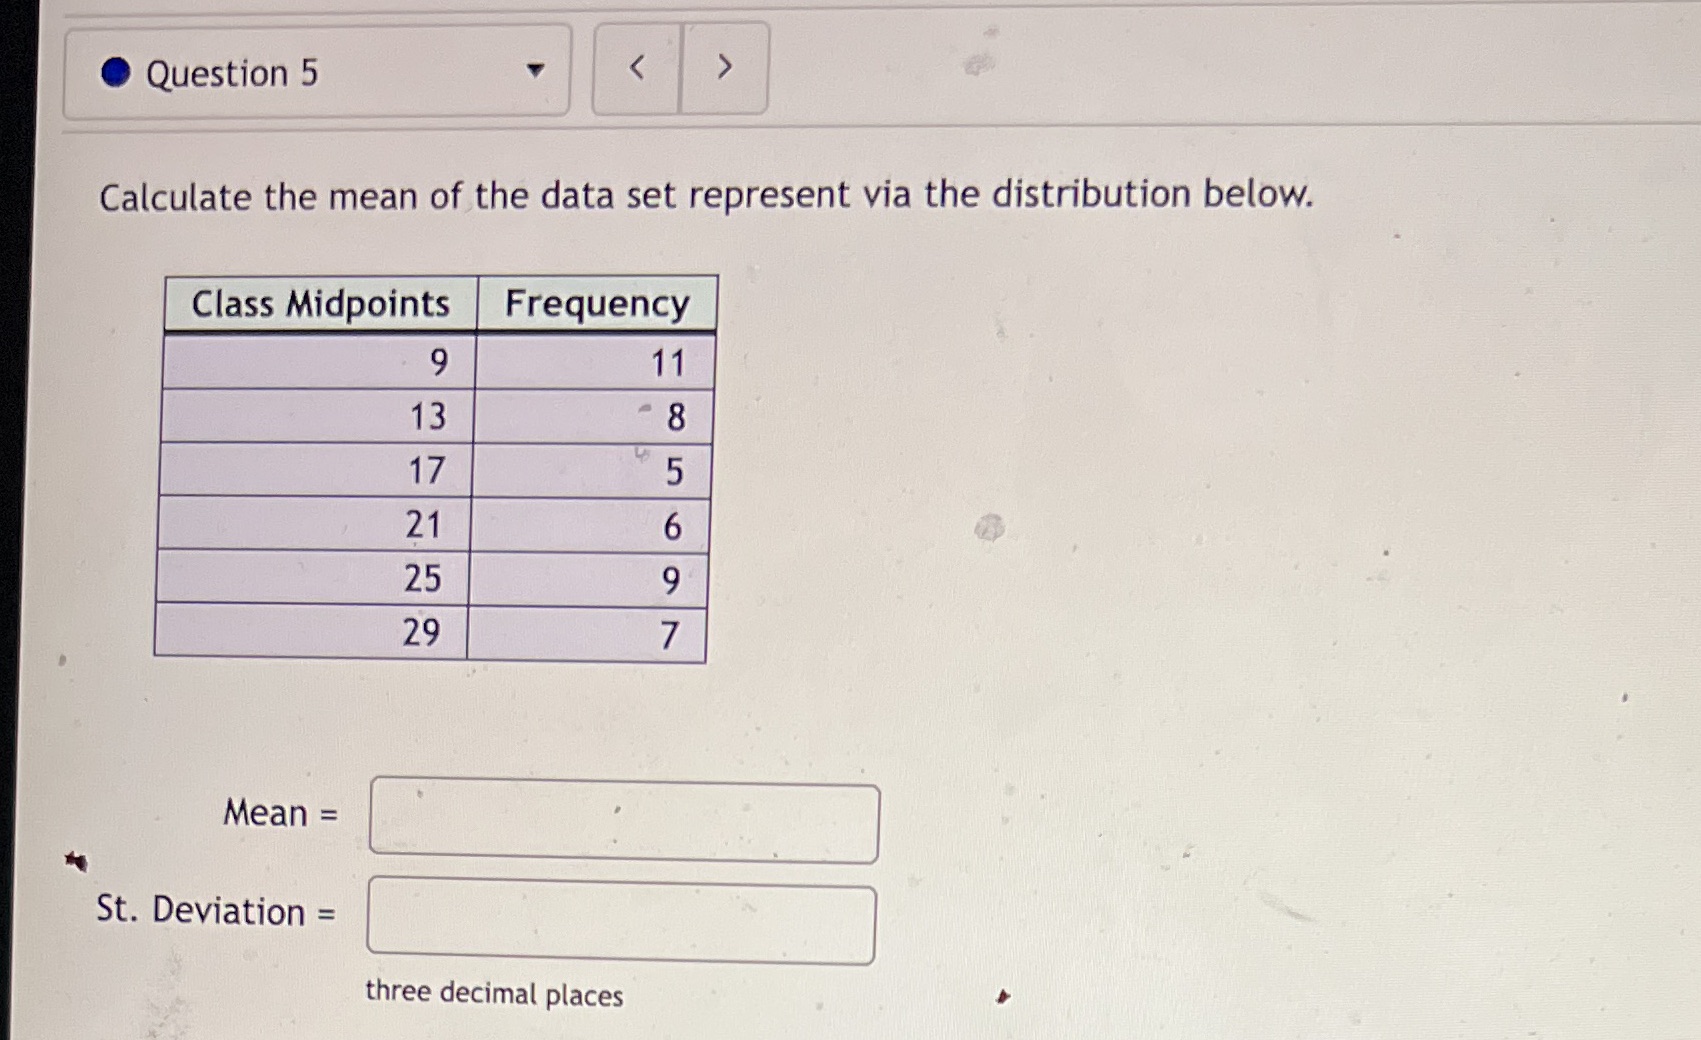
Question 5 Calculate the mean of the data set represent via the distribution below. Class Midpoints Frequency 11 13 21 25 29 Mean = St. Deviation = three decimal places
Step by Step Solution
There are 3 Steps involved in it
1 Expert Approved Answer
Step: 1 Unlock

Question Has Been Solved by an Expert!
Get step-by-step solutions from verified subject matter experts
Step: 2 Unlock
Step: 3 Unlock