

Question: Question 5: 4 marks (3 marks for question 1 and 1 mark for question 2) 2007 Using the following operating data for Liwa Corporation, illustrate
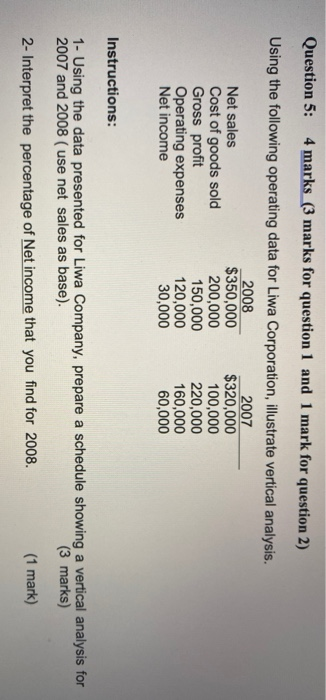
Question 5: 4 marks (3 marks for question 1 and 1 mark for question 2) 2007 Using the following operating data for Liwa Corporation, illustrate vertical analysis. 2008 Net sales $350,000 $320,000 Cost of goods sold 200,000 100,000 Gross profit 150,000 220,000 Operating expenses 120,000 160,000 Net income 30,000 60,000 Instructions: 1- Using the data presented for Liwa Company, prepare a schedule showing a vertical analysis for 2007 and 2008 (use net sales as base). (3 marks) 2- Interpret the percentage of Net income that you find for 2008. (1 mark)
Step by Step Solution
There are 3 Steps involved in it
1 Expert Approved Answer
Step: 1 Unlock

Question Has Been Solved by an Expert!
Get step-by-step solutions from verified subject matter experts
Step: 2 Unlock
Step: 3 Unlock