

Question: Question 5 (45 points, solve questions with Excel and then submit your file via Brightspace) The S&P/TSX Composite Index is the benchmark Canadian stock
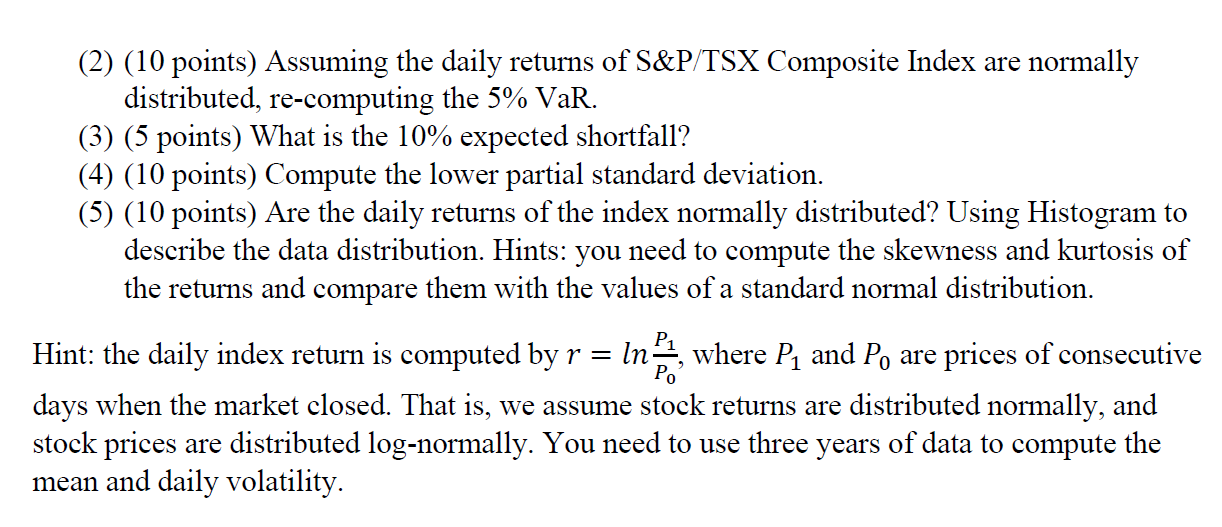

Question 5 (45 points, solve questions with Excel and then submit your file via Brightspace) The S&P/TSX Composite Index is the benchmark Canadian stock market index, representing about 77% of the total market capitalization on the Toronto Stock Exchange as of August 2022. It provides investors with a premier gauge regarding Canadian equity market performance. The index is also an investable portfolio for individual investors through mutual funds and exchange-traded funds (ETF) that track it. Suppose an investor invested $30,000 in an ETF that tracks the S&P/TSX Composite Index. She wants to know the maximum potential daily loss in the worst scenarios with a 95% confidence level. In other words, she needs to know the daily return at the 5% percentile of her daily return distribution, which is the VaR. A 5% VaR defines that 95% of returns will exceed the VaR and 5% below the VaR. She reached out to you to help predict the loss. You downloaded index data for the S&P/TSX Composite Index from Yahoo finance from January 1, 2020, to January 31, 2023. (1) (10 points) Compute the VaR values at the 5% percentile using historical data. (2) (10 points) Assuming the daily returns of S&P/TSX Composite Index are normally distributed, re-computing the 5% VaR. (3) (5 points) What is the 10% expected shortfall? (4) (10 points) Compute the lower partial standard deviation. (5) (10 points) Are the daily returns of the index normally distributed? Using Histogram to describe the data distribution. Hints: you need to compute the skewness and kurtosis of the returns and compare them with the values of a standard normal distribution. Hint: the daily index return is computed by r = In, where P and Po are prices of consecutive Po days when the market closed. That is, we assume stock returns are distributed normally, and stock prices are distributed log-normally. You need to use three years of data to compute the mean and daily volatility. 1 2 3 4 5 6 7 8 9 10 11 12 13 14 15 16 17 18 19 20 21 22 2222782 23 24 25 26 29 Date A B Open High 17100 17100 17033.2 17066.1 17066.1 17041.2 17105.5 17105.5 17110.3 17168.1 17168.1 02/01/2020 17131.6 17164.6 17043.5 03/01/2020 17054.8 17105.7 06/01/2020 17042.3 17105.5 07/01/2020 17119.6 17178 08/01/2020 17172.7 17229.9 17164.6 17167.8 17167.8 09/01/2020 17205.9 17255.5 17201.3 17235.6 17235.6 10/01/2020 17223.2 17254.1 17187.2 17234.5 17234.5 13/01/2020 17237.6 17301.8 17198.9 17293.4 17293.4 14/01/2020 17288.6 17356.5 17281.3 17352.9 17352.9 17364.8 17421.7 17345.1 17415.2 17415.2 17443.5 17489.6 17438.5 17484.8 17484.8 17502.4 17559 17559 15/01/2020 16/01/2020 17/01/2020 17507.7 20/01/2020 17548.1 17572.2 17620.2 17538.4 17597.4 17597.4 21/01/2020 17551.5 17572.3 17572.3 17589.5 17536.3 17666.5 22/01/2020 17570.3 17558 17599.9 17599.9 23/01/2020 17564.8 17621.8 17540.8 17621.8 17621.8 24/01/2020 17629.4 17646.4 17514.7 17565.3 17565.3 27/01/2020 17376.8 17466.1 17360 17442.5 17442.5 28/01/2020 17475 17519 17500.9 17500.9 17456.1 17496.7 17511.8 17511.8 29/01/2020 17547.5 17561.9 30/01/2020 17429.6 17502.9 17395.9 17490.6 17490.6 17442.3 17450.7 17272.7 17318.5 17318.5 17441.6 17351 17379.8 17379.8 04/02/2020 17548.8 17493.8 17512.7 17512.7 31/01/2020 03/02/2020 17351 17504.6 05/02/2020 17629.4 17674 17606.1 17651.6 17651.6 06/02/2020 17686.1 17758.5 17670.6 17757.5 17757.5 07/02/2020 17705.4 17716.7 17633 17655.5 10/02/2020 17646.6 17743.6 17646.6 17740.6 17740.6 17655.5 ^GSPTSE (1) Low D E Close F Adj Close Volume G 156213500 185492100 195351800 171935800 246980100 222501200 192514100 268086800 235495600 207645200 261420600 224673300 111821100 241563100 213329700 330914300 193689100 203774000 198139800 169412800 191070300 239157000 196331500 235045300 223399700 199327500 209827800 210735600 H
Step by Step Solution
3.30 Rating (165 Votes )
There are 3 Steps involved in it
To compute the Value at Risk VaR at the 5 percentile using historical data you would follow these st... View full answer

Get step-by-step solutions from verified subject matter experts