

Question: Question 5 (5 points Consider the figure 8.1, which is a family of average cost curves. The average total cost curve at a given level
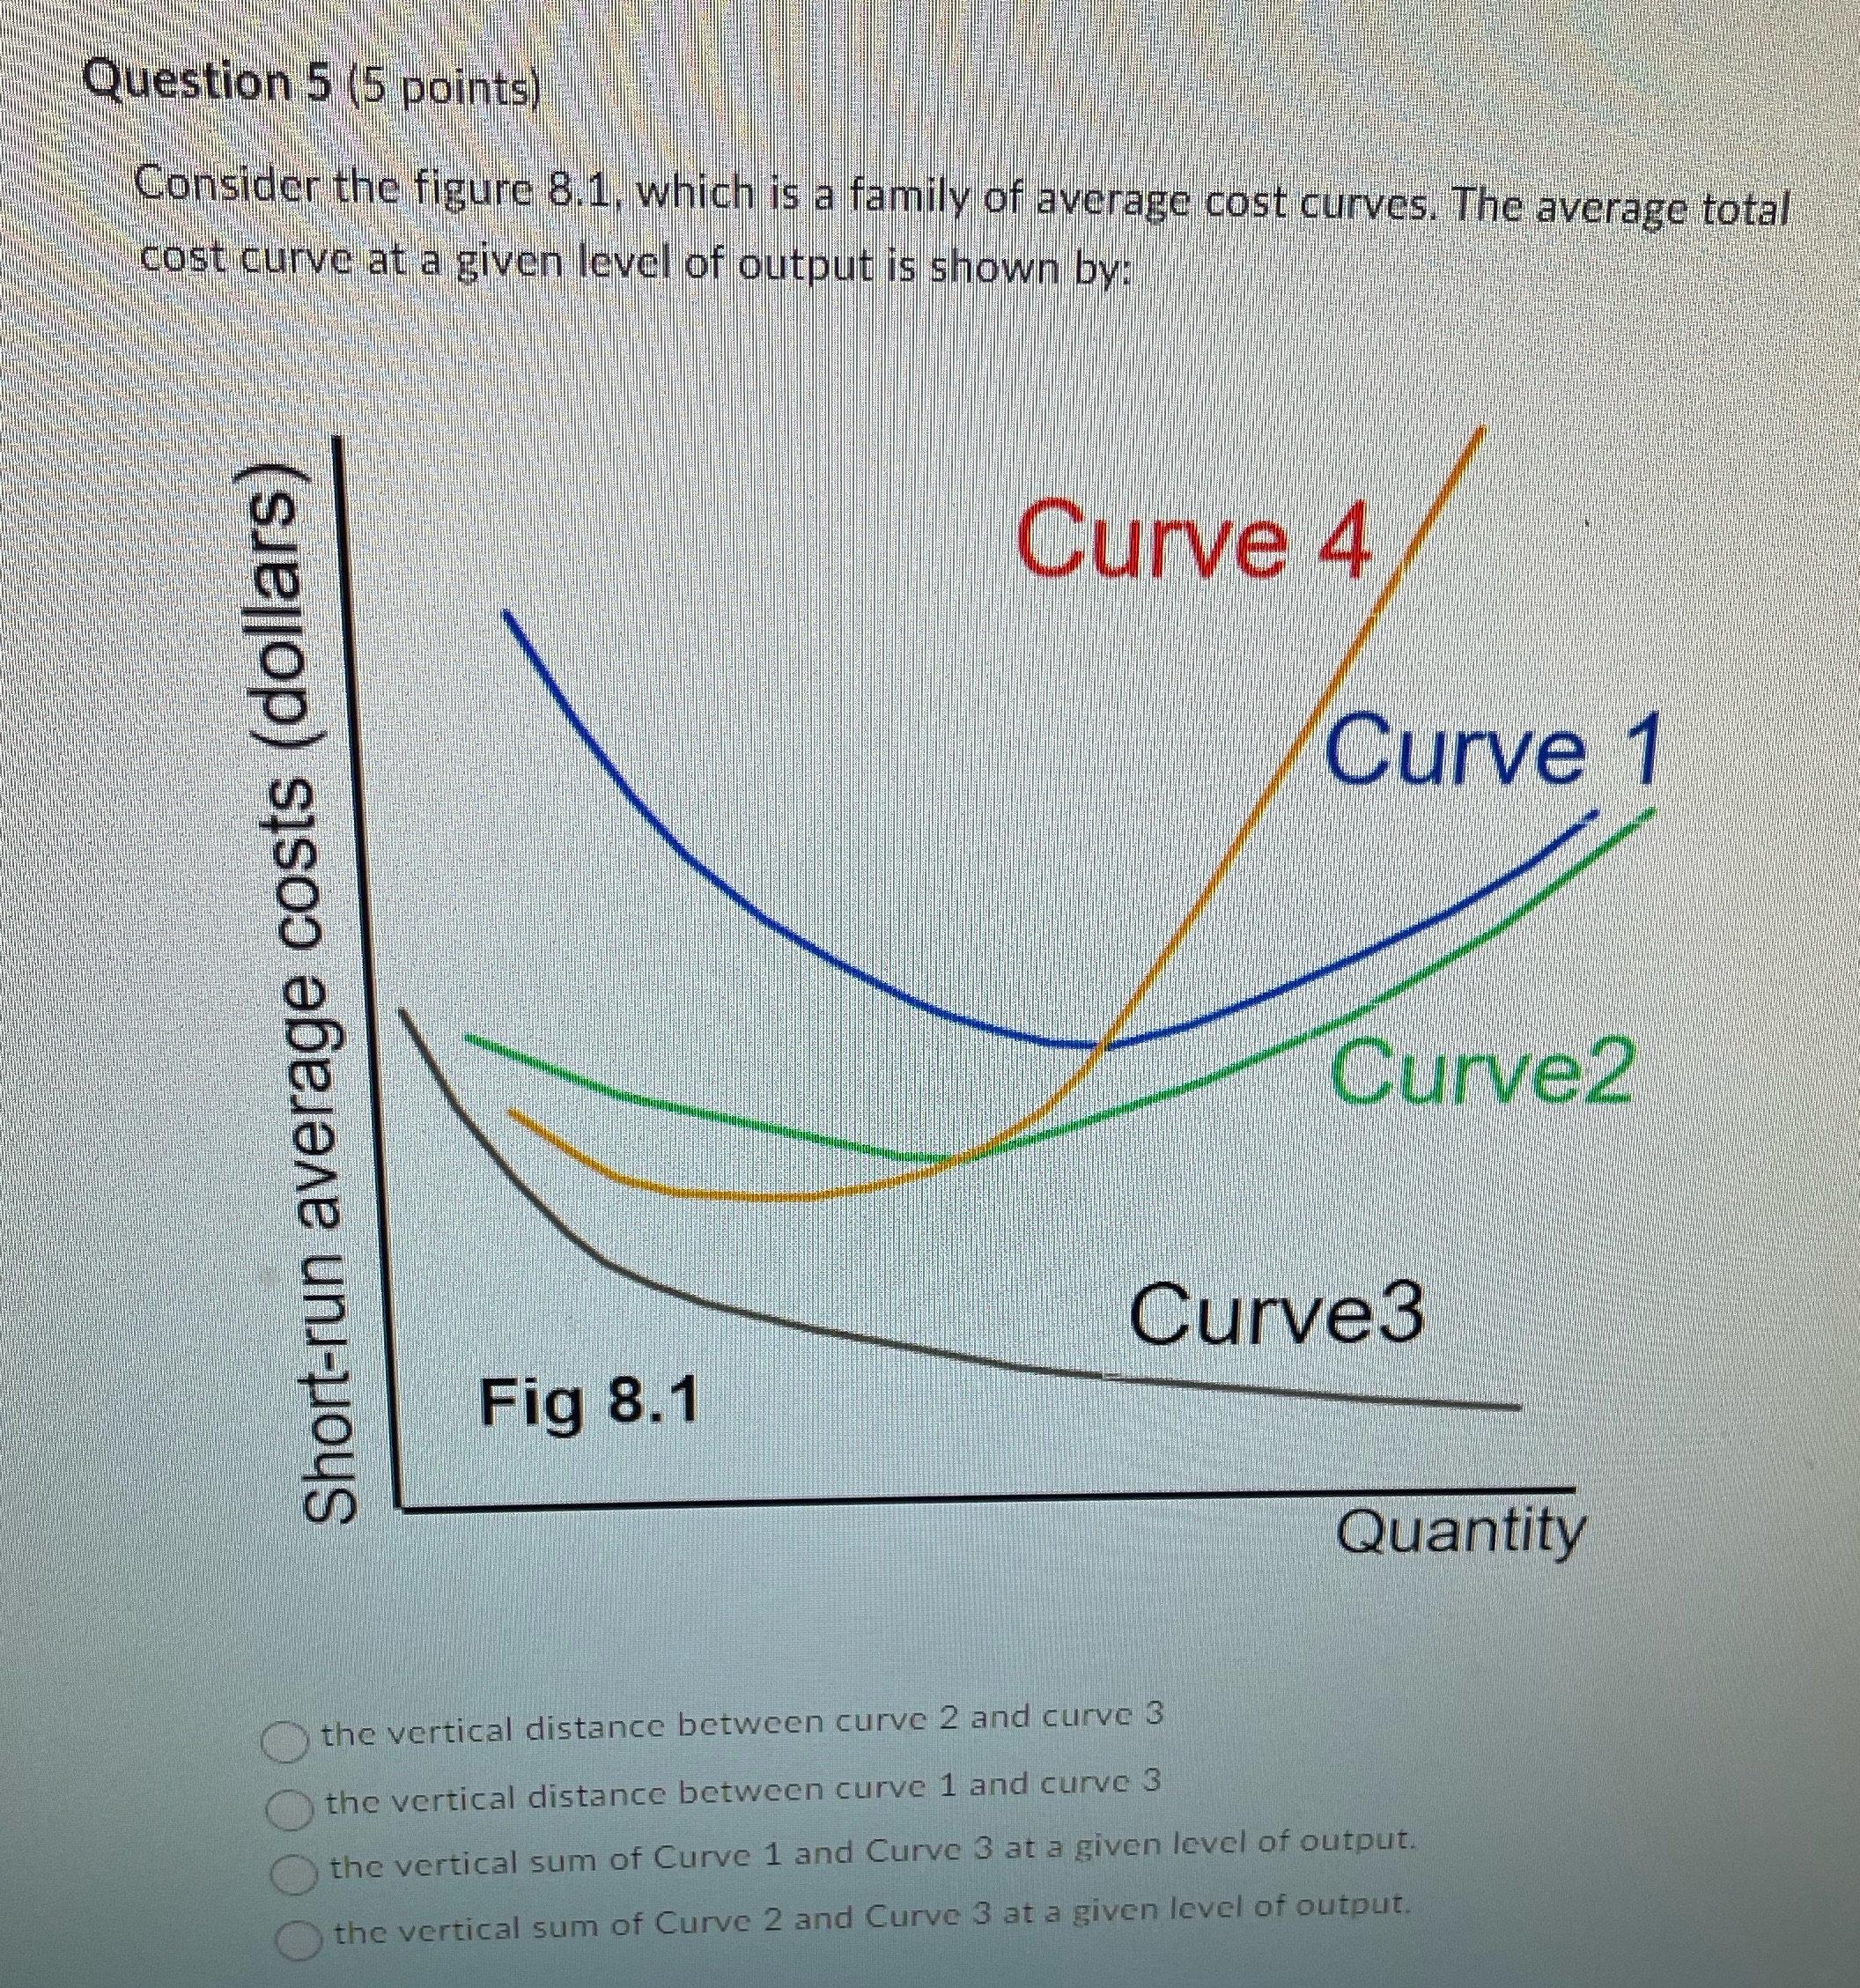
Question 5 (5 points Consider the figure 8.1, which is a family of average cost curves. The average total cost curve at a given level of output is shown by; Curve 4 Curve 1 Short-run average costs (dollars) Curve2 Curve3 Fig 8.1 Quantity the vertical distance between curve 2 and curve 3 the vertical distance between curve 1 and curve 3 the vertical sum of Curve 1 and Curve 3 at a given level of output. the vertical sum of Curve 2 and Curve 3 at a given level of output
Step by Step Solution
There are 3 Steps involved in it
1 Expert Approved Answer
Step: 1 Unlock

Question Has Been Solved by an Expert!
Get step-by-step solutions from verified subject matter experts
Step: 2 Unlock
Step: 3 Unlock