

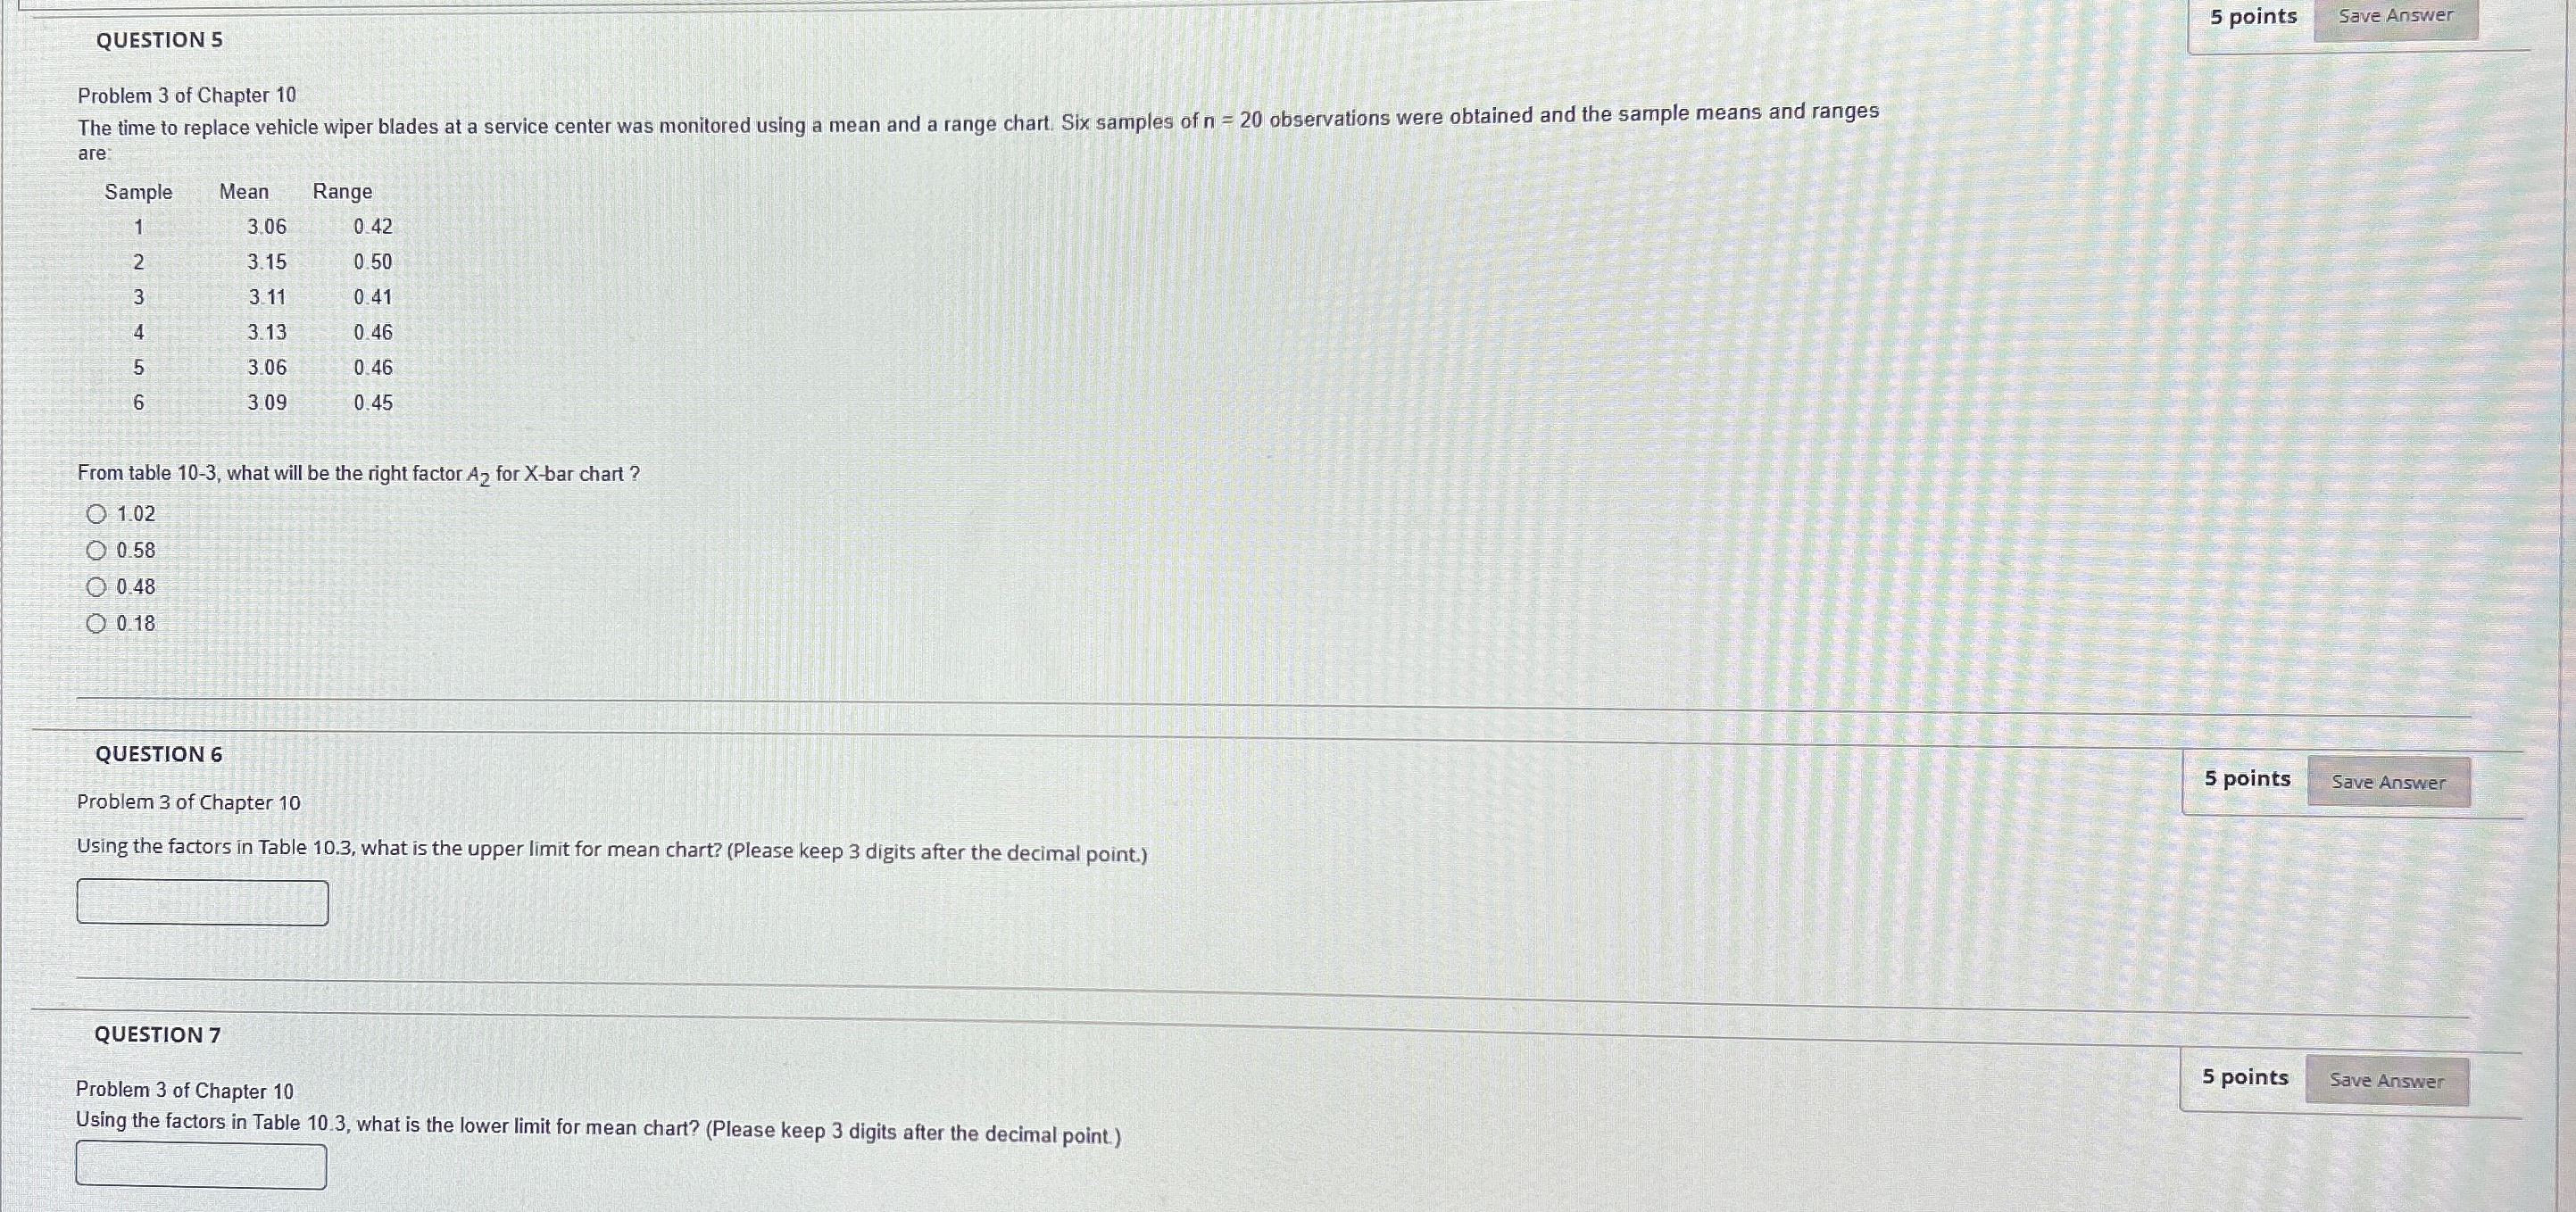
Question: QUESTION 5 5 points Save Answer Problem 3 of Chapter 1 0 are: table [ [ Sample , Mean,Range ] , [ 1 ,
QUESTION
points
Save Answer
Problem of Chapter are:
tableSampleMean,Range
From table what will be the right factor for bar chart?
QUESTION
points
Problem of Chapter
Using the factors in Table what is the upper limit for mean chart? Please keep digits after the decimal point.
QUESTION
Problem of Chapter
points
Using the factors in Table what is the lower limit for mean chart? Please keep digits after the decimal point
Step by Step Solution
There are 3 Steps involved in it
1 Expert Approved Answer
Step: 1 Unlock

Question Has Been Solved by an Expert!
Get step-by-step solutions from verified subject matter experts
Step: 2 Unlock
Step: 3 Unlock