

Question: Question 5 5 pts The box plot below shows annual salaries for Actuaries and CPAs across the country. CPA Actuary 30 40 50 60 70
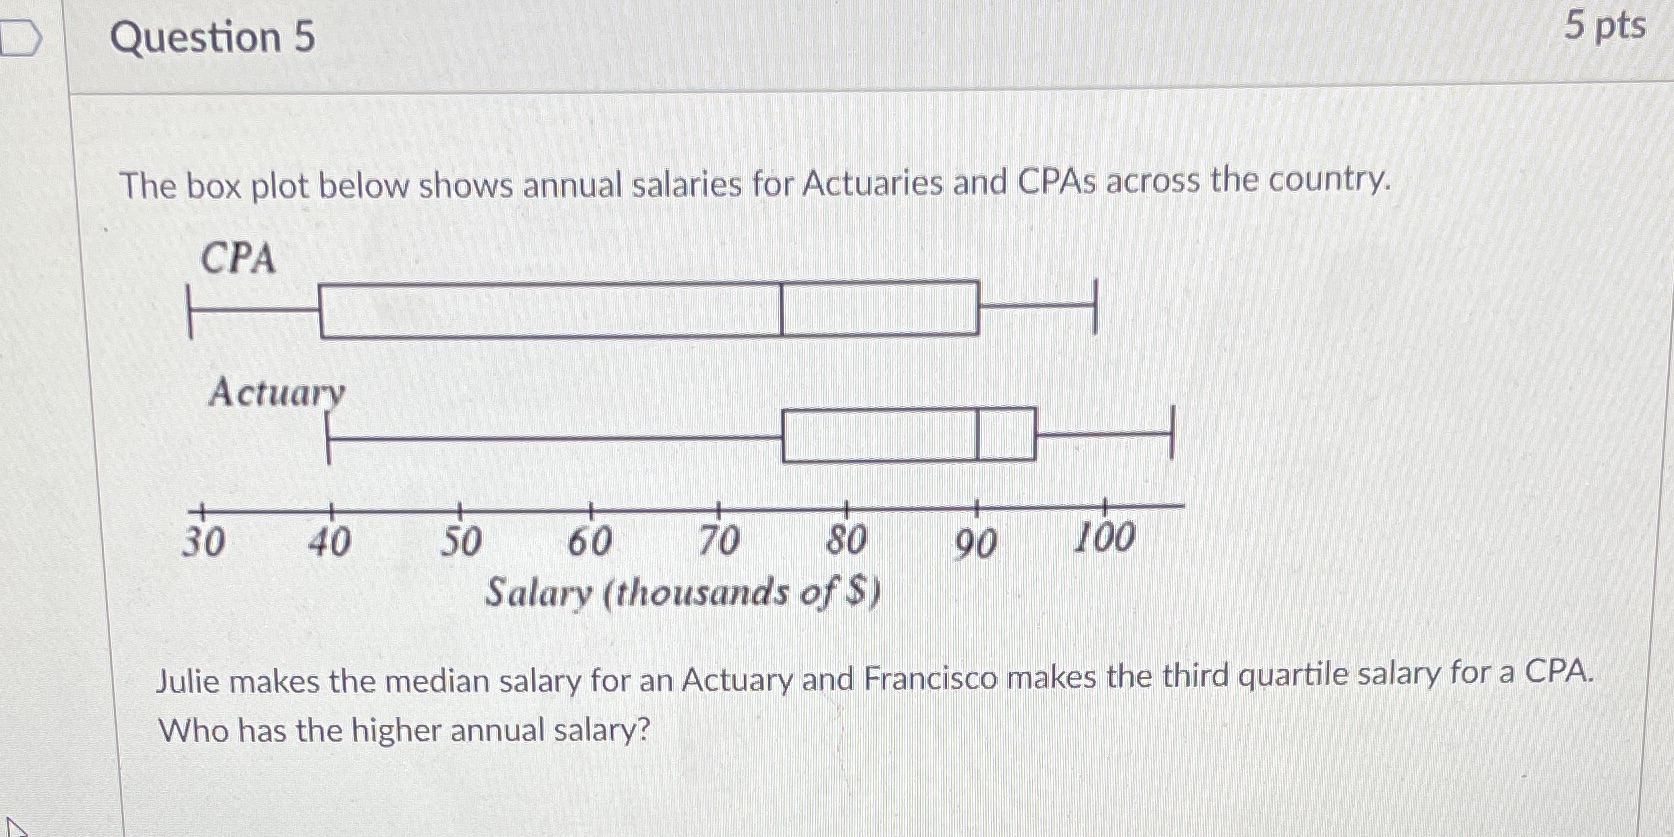
Question 5 5 pts The box plot below shows annual salaries for Actuaries and CPAs across the country. CPA Actuary 30 40 50 60 70 80 90 100 Salary (thousands of $) Julie makes the median salary for an Actuary and Francisco makes the third quartile salary for a CPA. Who has the higher annual salary
Step by Step Solution
There are 3 Steps involved in it
1 Expert Approved Answer
Step: 1 Unlock

Question Has Been Solved by an Expert!
Get step-by-step solutions from verified subject matter experts
Step: 2 Unlock
Step: 3 Unlock