

Question: Question 5 (8 marks) a. Using the data found in Question 1, calculate (to 2 decimal places) the elasticity of demand and elasticity of supply
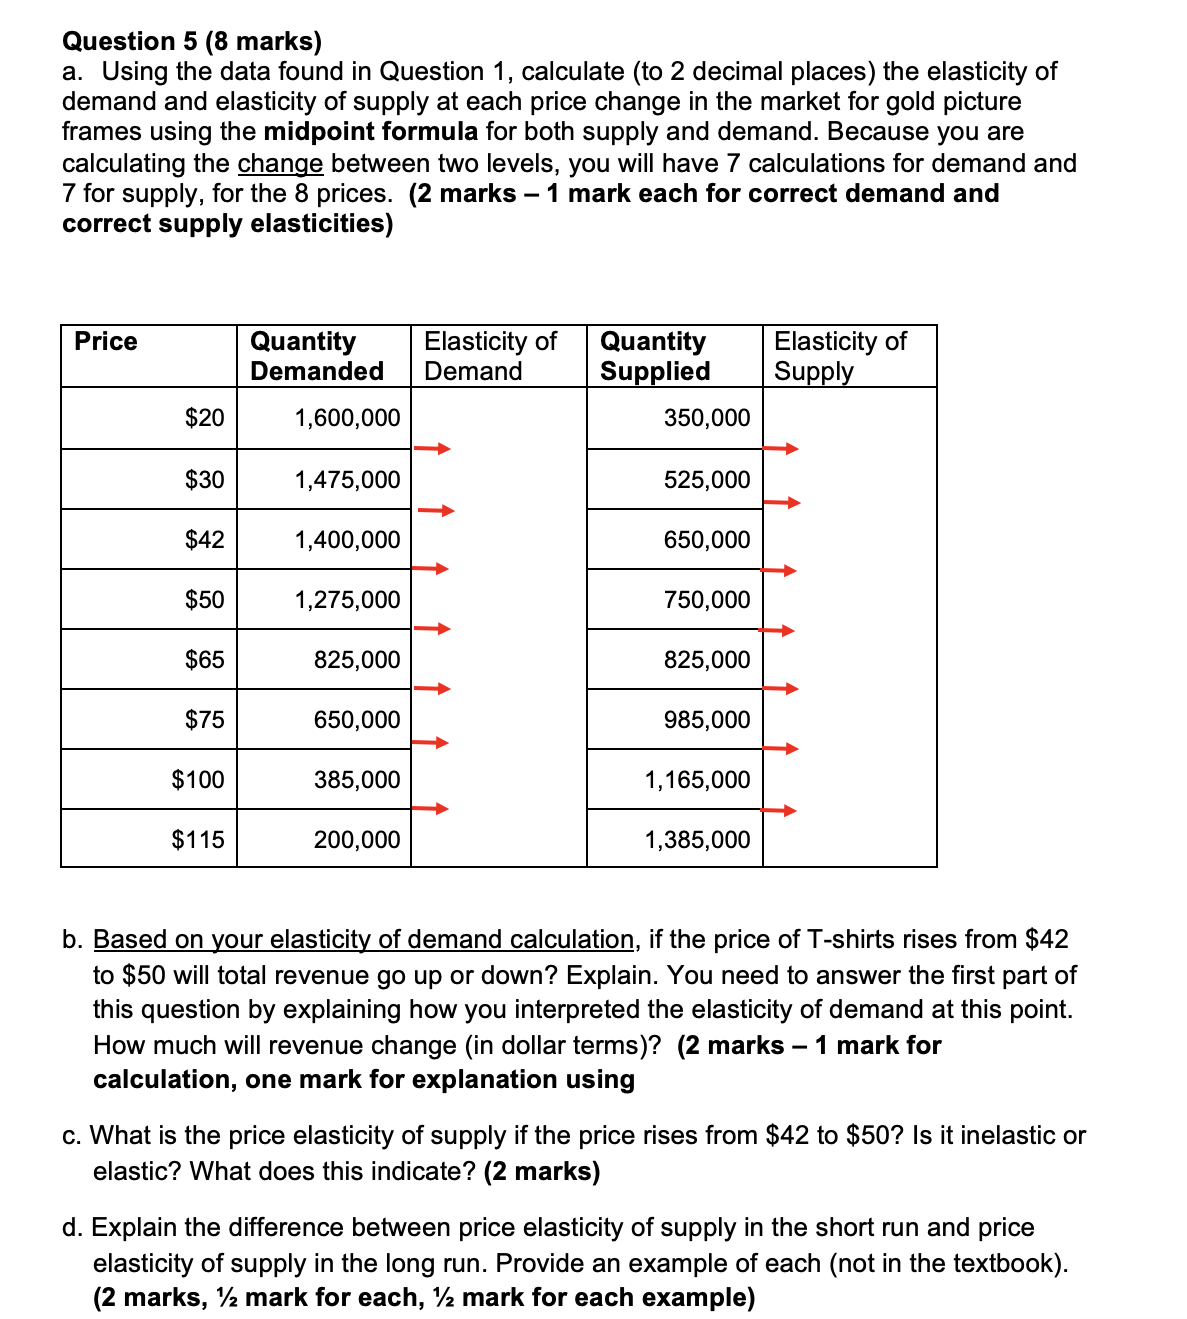


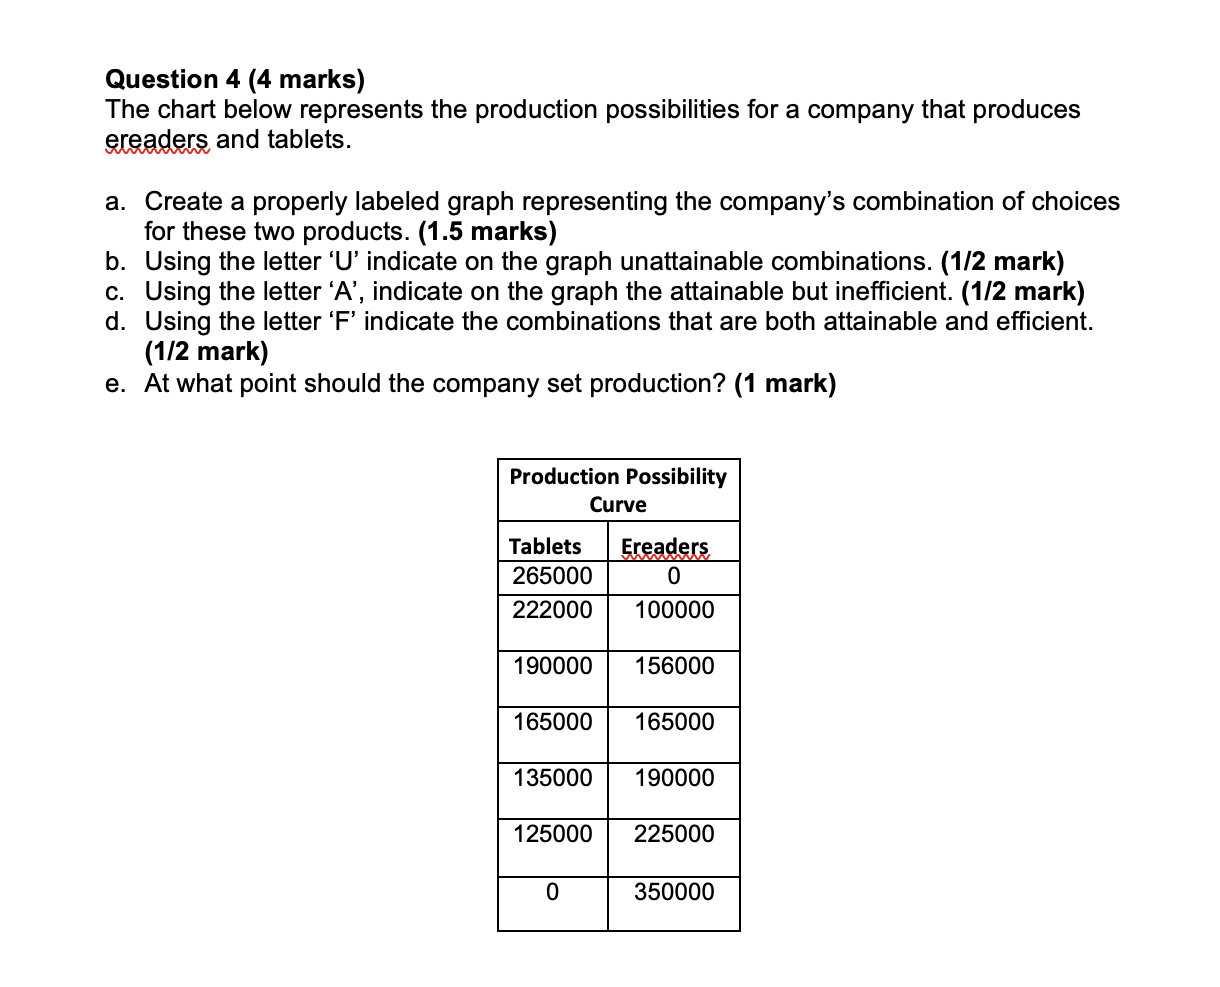

Question 5 (8 marks) a. Using the data found in Question 1, calculate (to 2 decimal places) the elasticity of demand and elasticity of supply at each price change in the market for gold picture frames using the midpoint formula for both supply and demand. Because you are calculating the change between two levels, you will have 7 calculations for demand and 7 for supply, for the 8 prices. (2 marks 1 mark each for correct demand and correct supply elasticities) Quantity Elasticity of Quantity Elasticity of Demanded Demand Supplied Supply - 1, 600, 000 350,000 - 1,,400 000. 650,000 -: -- b. Based on your elasticity of demand calculation, if the price of Tshirts rises from $42 to $50 will total revenue go up or down? Explain. You need to answer the first part of this question by explaining how you interpreted the elasticity of demand at this point. How much will revenue change (in dollar terms)? (2 marks 1 mark for calculation, one mark for explanation using c. What is the price elasticity of supply if the price rises from $42 to $50? Is it inelastic or elastic? What does this indicate? (2 marks) d. Explain the difference between price elasticity of supply in the short run and price elasticity of supply in the long run. Provide an example of each (not in the textbook). (2 marks, 1/z mark for each, 1/z mark for each example) Question 4 (4 marks) The chart below represents the production possibilities for a company that produces waders and tablets. a. Create a properly labeled graph representing the company's combination of choices for these two products. (1.5 marks) b. Using the letter 'U' indicate on the graph unattainable combinations. (11'2 mark) c. Using the letter 'A', indicate on the graph the attainable but inefficient. (112 mark) d. Using the letter 'F' indicate the combinations that are both attainable and efficient. (112 mark) e. At what point should the company set production? (1 mark) Production Possibility Curve 200000 I- 222000 100000 190000 156000 165000 165000 135000 190000 125000 225000 Question 7 (3 marks) Assume the government has set a price floor of $4.50 for a loaf of sour dough bread. The equilibrium price in the market is $3.85. Will this create a shortage or a surplus of sour dough bread in the market? Explain why, and draw a graph that illustrates the market given the price floor
Step by Step Solution
There are 3 Steps involved in it

Get step-by-step solutions from verified subject matter experts