

Question: QUESTION 5 A plot that shows the relationship between two variables is O a. probability density function O b. cumulative distribution function O c. scatter
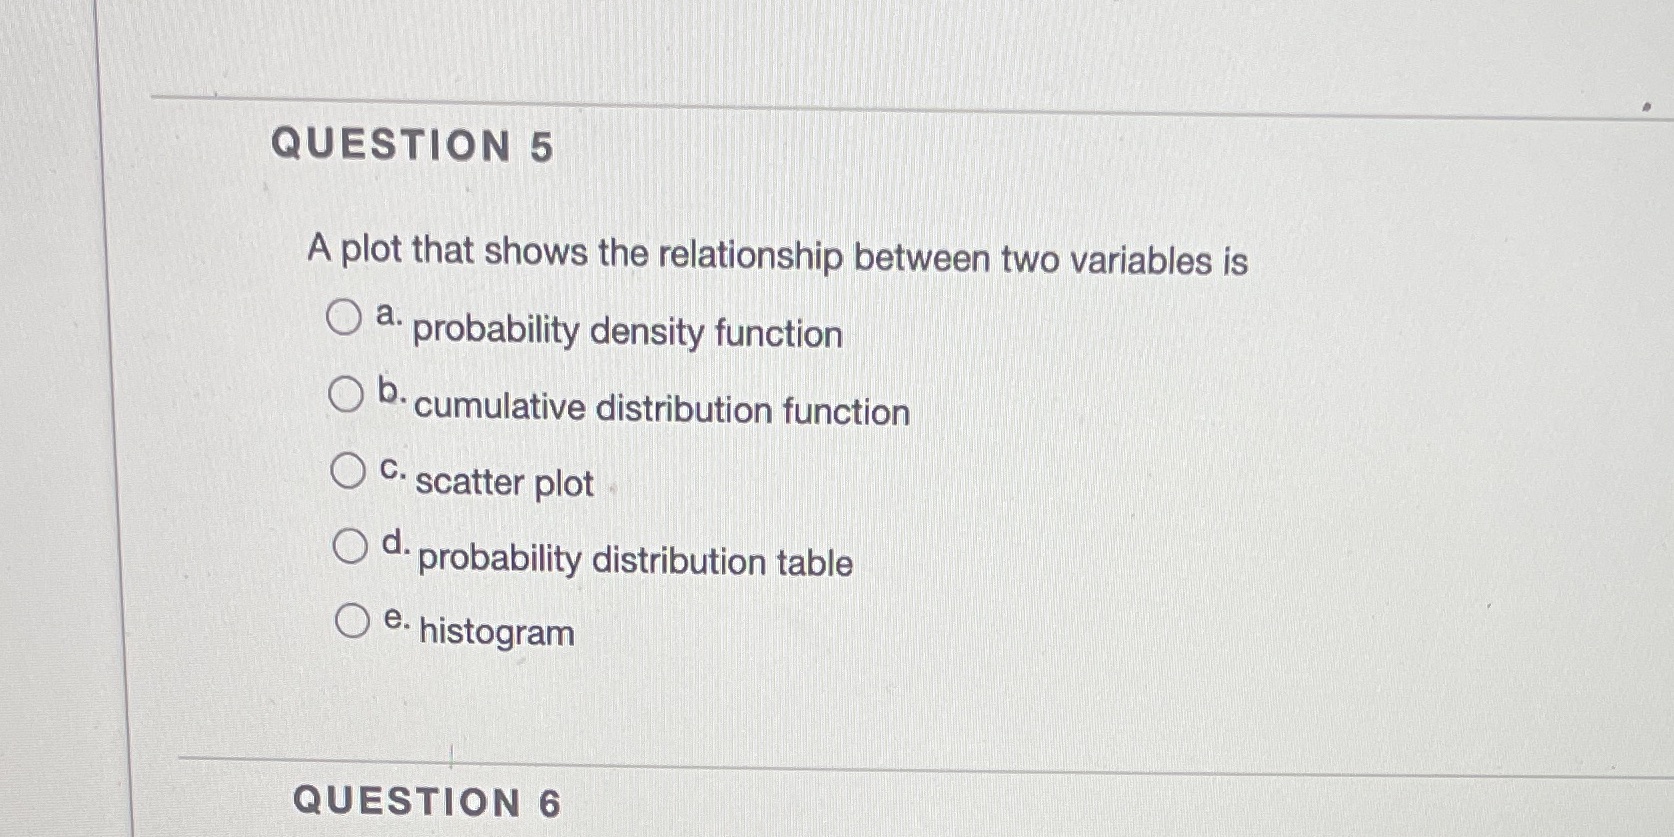
QUESTION 5 A plot that shows the relationship between two variables is O a. probability density function O b. cumulative distribution function O c. scatter plot O d. probability distribution table O e. histogram QUESTION 6
Step by Step Solution
There are 3 Steps involved in it
1 Expert Approved Answer
Step: 1 Unlock

Question Has Been Solved by an Expert!
Get step-by-step solutions from verified subject matter experts
Step: 2 Unlock
Step: 3 Unlock