

Question: Question 5 ( a ) Table 2 shows the demand figures for a product over a six - month period. Copy the table into your
Question
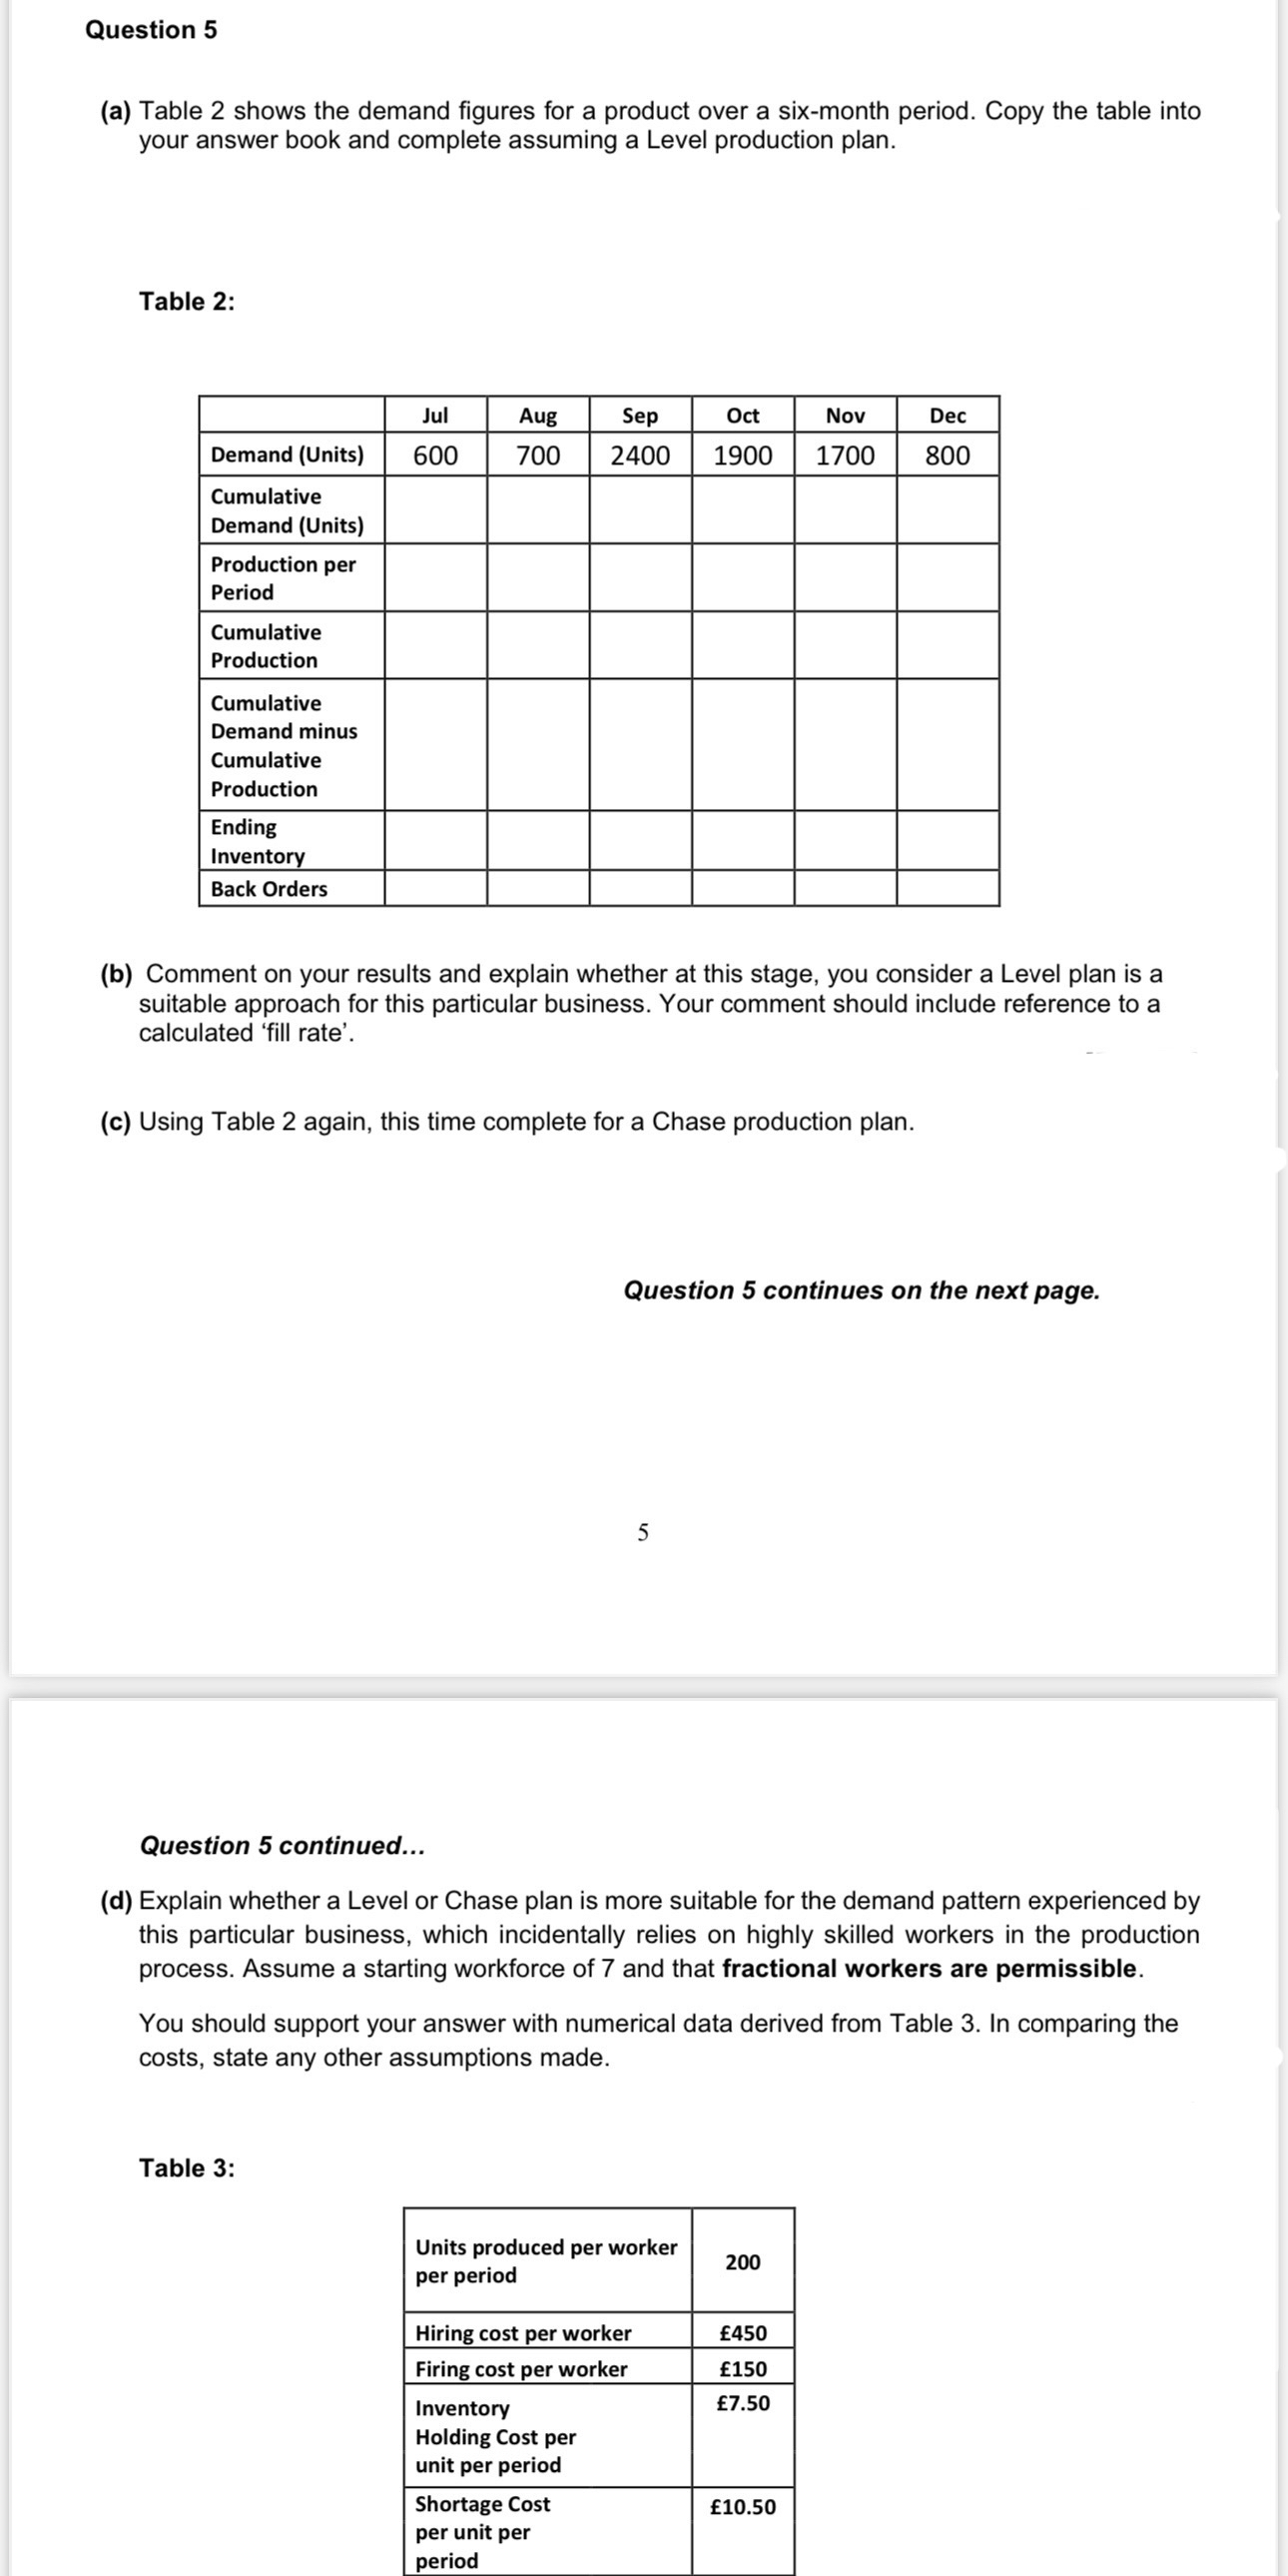
a Table shows the demand figures for a product over a sixmonth period. Copy the table into your answer book and complete assuming a Level production plan.
Table :
tableJul,Aug,Sep,Oct,Nov,DecDemand UnitstableCumulativeDemand UnitstableProduction perPeriodtableCumulativeProductiontableCumulativeDemand minusCumulativeProductiontableEndingInventoryBack Orders,,,,,,
b Comment on your results and explain whether at this stage, you consider a Level plan is a suitable approach for this particular business. Your comment should include reference to a calculated 'fill rate'.
c Using Table again, this time complete for a Chase production plan.
Question continues on the next page.
Question continued...
d Explain whether a Level or Chase plan is more suitable for the demand pattern experienced by this particular business, which incidentally relies on highly skilled workers in the production process. Assume a starting workforce of and that fractional workers are permissible.
You should support your answer with numerical data derived from Table In comparing the costs, state any other assumptions made.
Table :
tabletableUnits produced per workerper period
Step by Step Solution
There are 3 Steps involved in it
1 Expert Approved Answer
Step: 1 Unlock

Question Has Been Solved by an Expert!
Get step-by-step solutions from verified subject matter experts
Step: 2 Unlock
Step: 3 Unlock