

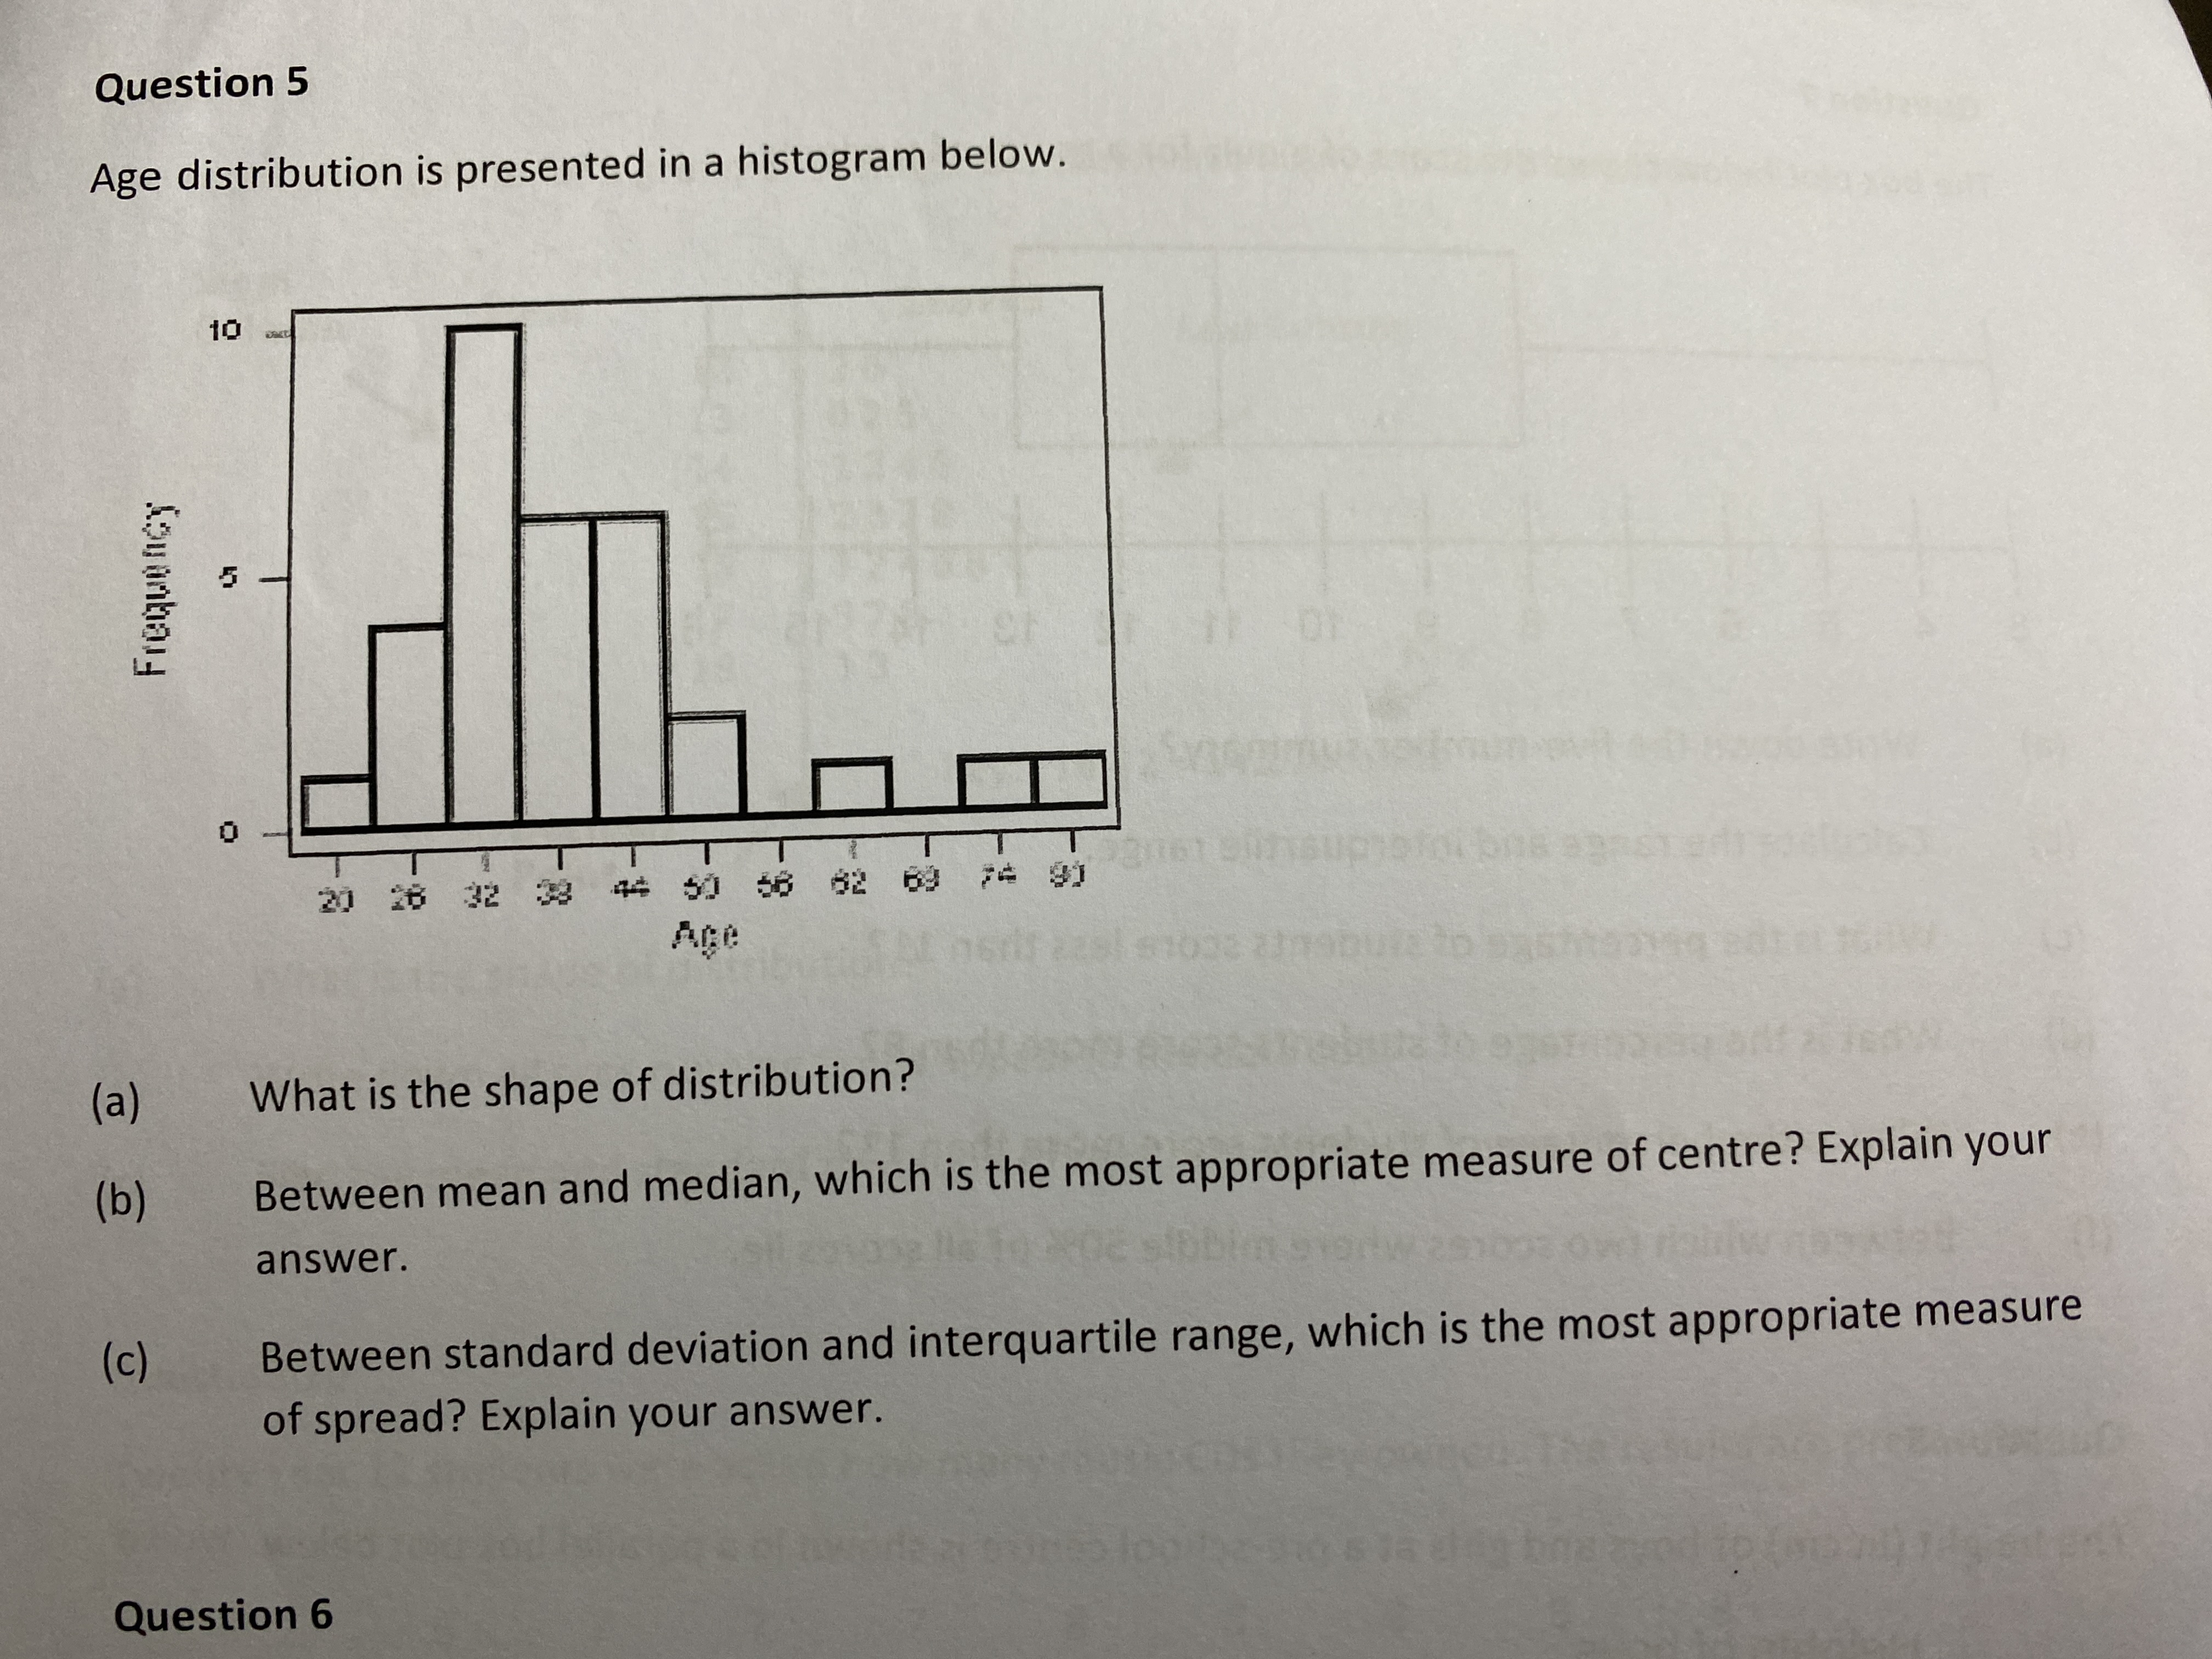
Question: Question 5 Age distribution is presented in a histogram below. 10 5 Frequency 20 26 32 33 44 50 6 62 63 74 9) Age
Step by Step Solution
There are 3 Steps involved in it

Get step-by-step solutions from verified subject matter experts