

Question: Question 5 and 6 have me stuck because I do not understand what they are asking for, I sent photos of the previous questions code
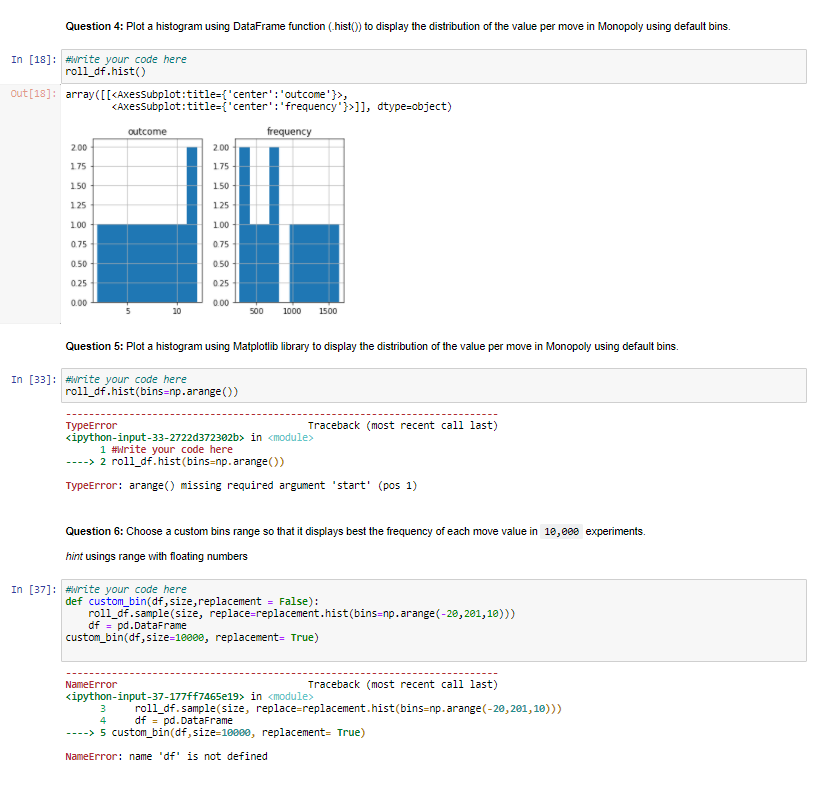
Question 5 and 6 have me stuck because I do not understand what they are asking for, I sent photos of the previous questions code to help you get some context. Thank you! Question 4 might not be correct as well.
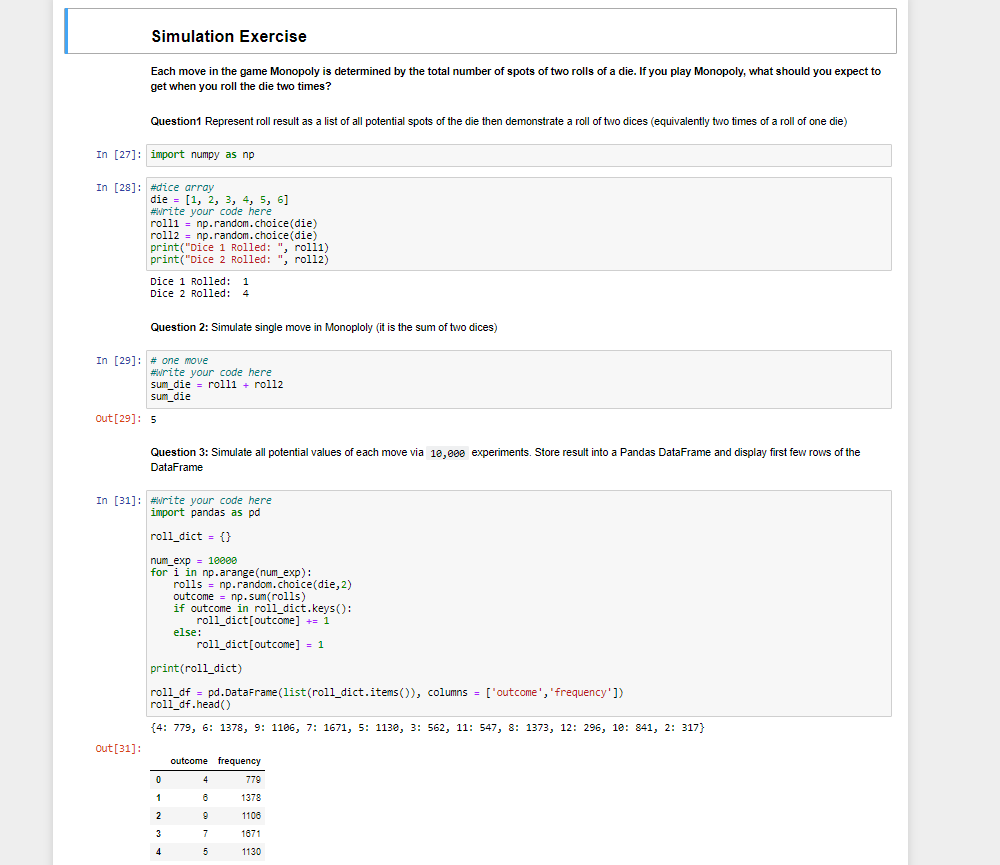
Simulation Exercise Each move in the game Monopoly is determined by the total number of spots of two rolls of a die. If you play Monopoly, what should you expect to get when you roll the die two times? Question1 Represent roll result as a list of all potential spots of the die then demonstrate a roll of two dices (equivalently two times of a roll of one die) In [27]: import numpy as np In [28]: #dice array die = (1, 2, 3, 4, 5, 6] #write your code here rolli = np.random.choice (die) roll2 = np.random.choice(die) print("Dice 1 Rolled: rolli) print("Dice 2 Rolled: ", rollz) Dice 1 Rolled: 1 Dice 2 Rolled: 4 Question 2: Simulate single move in Monoploly (it is the sum of two dices) In [29]: # one move #Write your code here sum_die = rolli + roll2 sum_die Out[29]: 5 Question 3: Simulate all potential values of each move via 10,688 experiments. Store result into a Pandas DataFrame and display first few rows of the DataFrame In [31]: #Write your code here import pandas as pd roll_dict = {} num_exp = 18000 for i in np.arange(num_exp): rolls = np.random.choice(die, 2) outcome = np.sum(rolls) if outcome in roll_dict.keys(): roll_dict(outcome] += 1 else: roll_dict(outcome) = 1 print(roll_dict) roll_df = pd.DataFrame(list(roll_dict.items()), columns = ['outcome', 'frequency']) roll df.head() {4: 779, 6: 1378, 9: 1106, 7: 1671, 5: 1138, 3: 562, 11: 547, 8: 1373, 12: 296, 10: 841, 2: 317} Out[31]: outcome frequency 4 779 0 1 1 6 1378 2 9 1106 3 7 1671 4 5 1130 Question 4: Plot a histogram using DataFrame function (hist()) to display the distribution of the value per move in Monopoly using default bins. In [18]: #write your code here roll_df.hist() Out[18]: array([[
Step by Step Solution
There are 3 Steps involved in it

Get step-by-step solutions from verified subject matter experts