

Question: Question 5. Based on the percentage frequency histograms and summary statistics, discuss two similarities in the shape of the distributions. Quote relevant evidence for your
Question 5. Based on the percentage frequency histograms and summary statistics, discuss two similarities in the shape of the distributions. Quote relevant evidence for your answers.Question 6. Compare the central tendency of the departure and arrival delay time distributions. What is your overall observation? Discuss the best measure for this comparison and why you have chosen this measure. (Hint: Quote relevant evidences for your answer)Question 7. Overall, which delay times are more volatile, departure delay or arrival delay? Use all measures available to discuss your answers. Which is the best measure in this case? Why have you selected this measure? Discuss whether the conclusion makes sense in real live. (Hint: Quote relevant evidence for your answer)
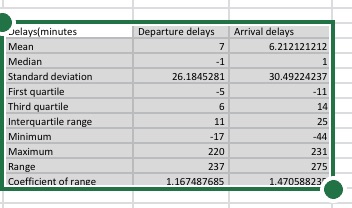
Jelays minutes Departure delays Arrival delays Mean 7 6.212121212 Median -1 Standard deviation 26.1845281 30.49224237 First quartile -5 -11 Third quartile 6 14 Interquartile range 11 25 Minimum -17 -44 Maximum 220 231 Range 237 275 Coefficient of range 1.167487685 1.470588237
Step by Step Solution
There are 3 Steps involved in it

Get step-by-step solutions from verified subject matter experts