

Question: Question 5 . ( contd . ) b ) The diagram below shows two small watersheds ( I and II ) feeding into a reinforced
Question contd
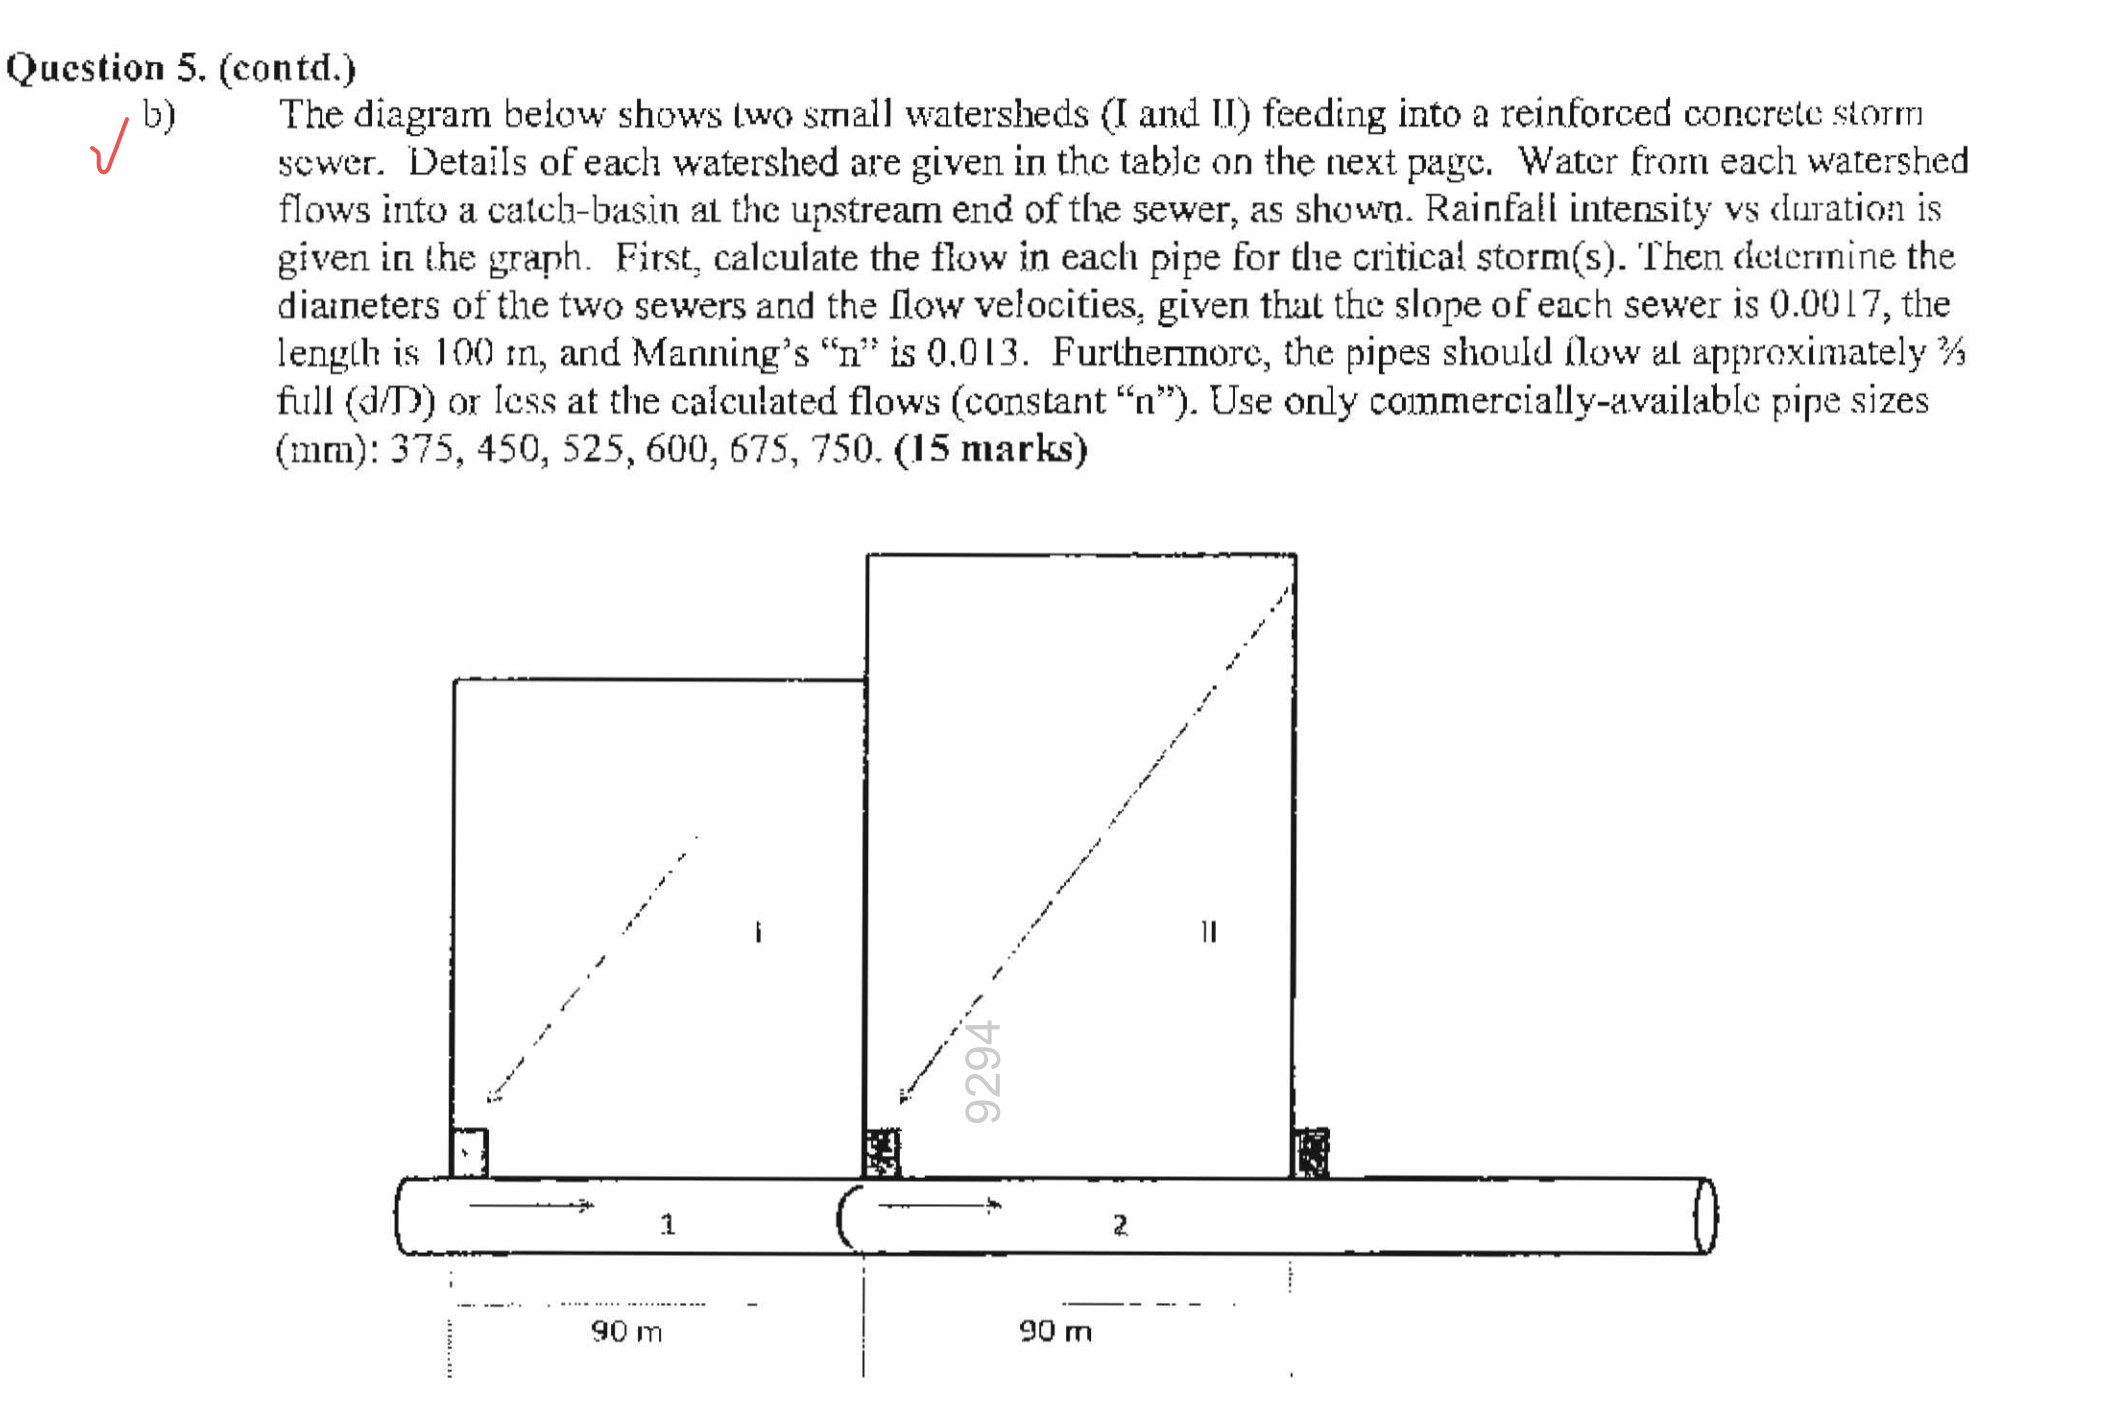
b The diagram below shows two small watersheds I and II feeding into a reinforced concrete storm sewer. Details of each watershed are given in the table on the next page. Water from each watershed flows into a catclabasin al the upstream end of the sewer, as shown. Rainfall intensity vs duration is given in the graph. First, calculate the flow in each pipe for the critical storms Then determine the diameters of the two sewers and the flow velocities, given that the slope of each sewer is the length is mn and Manning's n is Furthennore, the pipes should ilow at approximately full mathrmdmathrmD or less at the calculated flows constant n Use only commerciallyavailable pipe sizes mathrmmm: marks
Step by Step Solution
There are 3 Steps involved in it
1 Expert Approved Answer
Step: 1 Unlock

Question Has Been Solved by an Expert!
Get step-by-step solutions from verified subject matter experts
Step: 2 Unlock
Step: 3 Unlock