

Question: Question 5: [does not require SPSS] The Indigo Insurance Company is a large company based in Melbourne. Several years ago, an email survey of all
![Question 5: [does not require SPSS] The Indigo Insurance Company is](https://s3.amazonaws.com/si.experts.images/answers/2024/07/668d9de21763b_025668d9de1e2ec8.jpg)
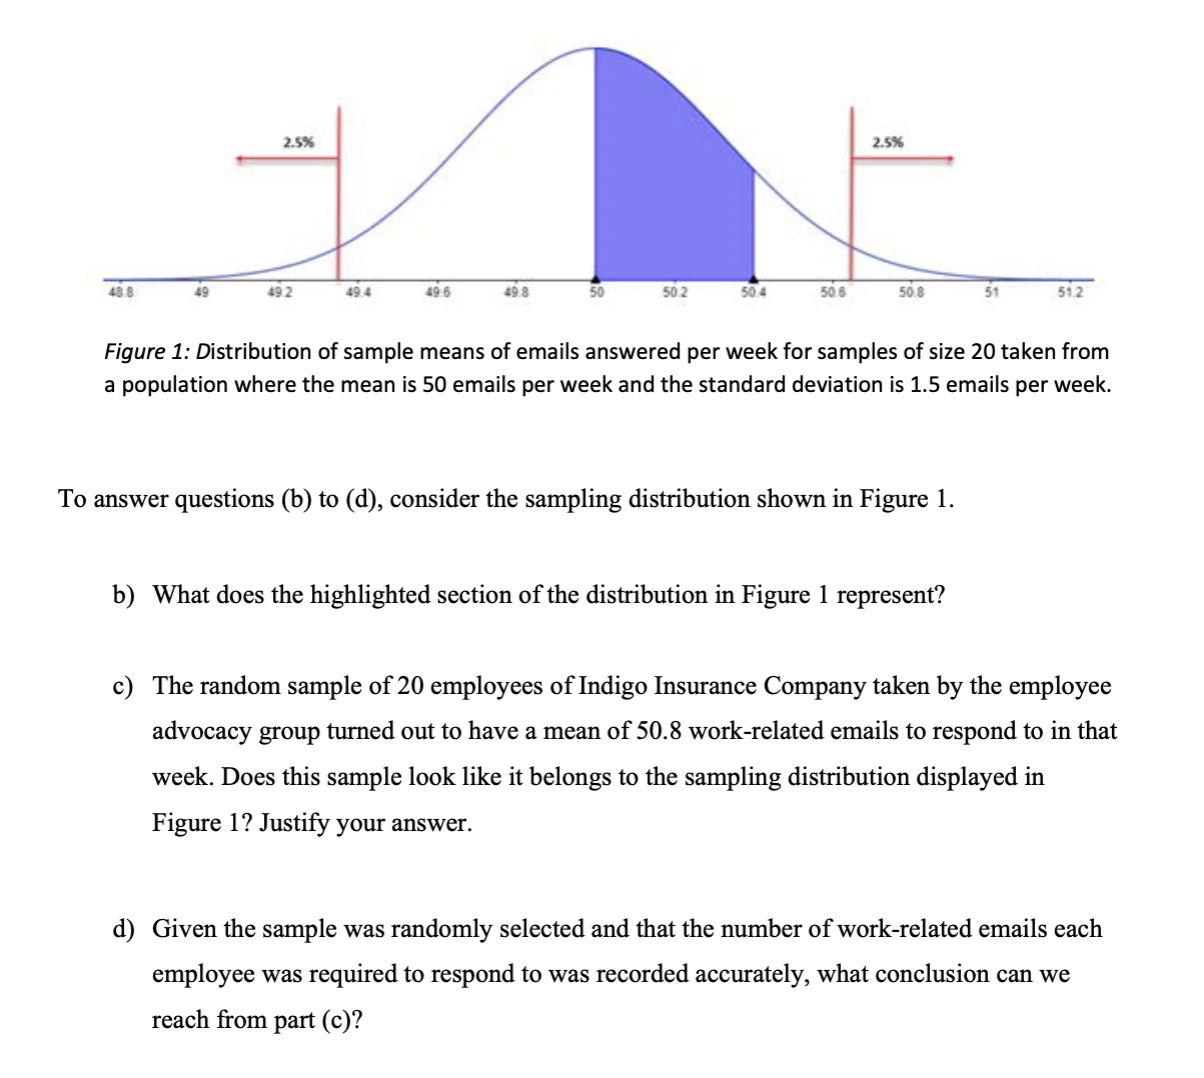
Question 5: [does not require SPSS] The Indigo Insurance Company is a large company based in Melbourne. Several years ago, an email survey of all their employees found that employees were required to respond to an average of 50 workrelated emails per week with a standard deviation of 1.5 emails per week. However, an employee advocacy group believes the average number of workrelated emails Indigo Insurance Company employees are now required to respond to is more than 50 emails per week. To investigate this further, the employee advocacy group took a random sample of 20 staff employed by Indigo Insurance Company during the second week of March 2021, which required these employees to record the number of work-related emails to which they were required to respond. a) What is the population we can draw conclusions about in this study? We have produced a distribution of sample means of emails answered per week for samples of size 20, taken from a population where the mean is 50 emails per week and the standard deviation is 1.5 emails per week. The sampling distribution is displayed below in Figure 1. 1.9% I.\" an n as: as: us an so so: so: 506 508 st 512 Figure 1: Distribution of sample means of emails answered per week for samples of size 20 ta ken from a population where the mean is 50 emails per week and the standard deviation is 1.5 emails per week. To answer questions (b) to (d), consider the sampling distribution shown in Figure l. b) What does the highlighted section of the distribution in Figure 1 represent? 0) The random sample of 20 employees of Indigo Insmauce Company taken by the employee advocacy group turned out to have a mean of 50.8 workrelated emails to respond to in that week. Does this sample look like it belongs to the sampling distribution displayed in Figure 1? Justify your answer. d) Given the sample was randomly selected and that the number of workrelated emails each employee was required to respond to was recorded accurately, what conclusion can we reach rom part (c)
Step by Step Solution
There are 3 Steps involved in it

Get step-by-step solutions from verified subject matter experts