

Question: QUESTION 5 From the Table of data given below using SAS we obtain the following summary statistics. (a) What does the MANOVA test procedure perform
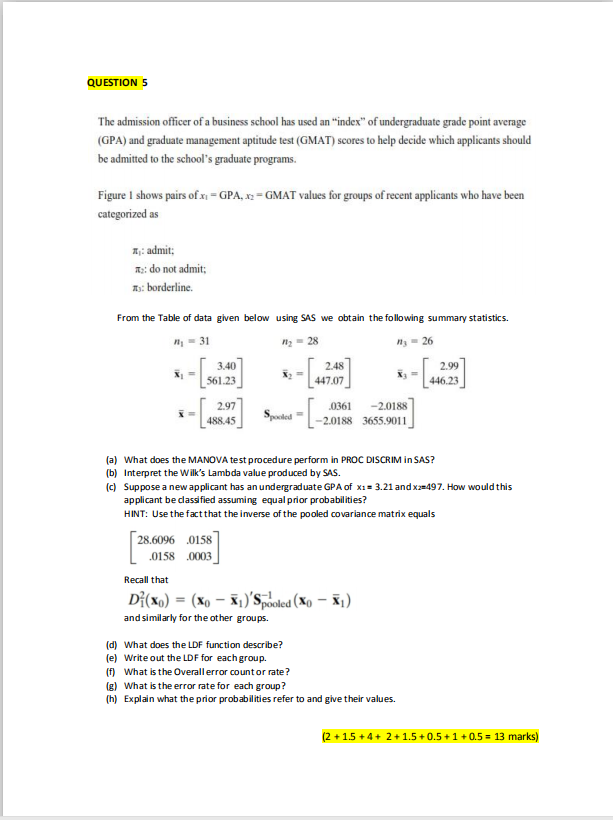
QUESTION 5
From the Table of data given below using SAS we obtain the following summary statistics.
(a) What does the MANOVA test procedure perform in PROC DISCRIM in SAS?
(b) Interpret the Wilk's Lambda value produced by SAS.
(c) Suppose a new applicant has an undergraduate GPA of x1 = 3.21 and x2=497. How would this
applicant be classified assuming equal prior probabilities?
HINT: Use the fact that the inverse of the pooled covariance matrix equals
Recall that
and similarly for the other groups.
(d) What does the LDF function describe?
(e) Write out the LDF for each group.
(f) What is the Overall error count or rate?
(g) What is the error rate for each group?
(h) Explain what the prior probabilities refer to and give their values.
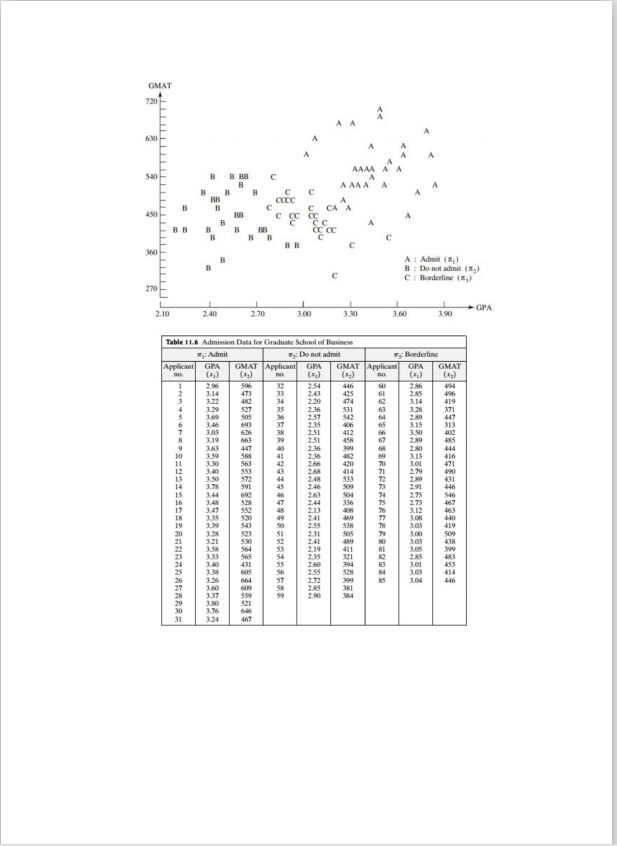
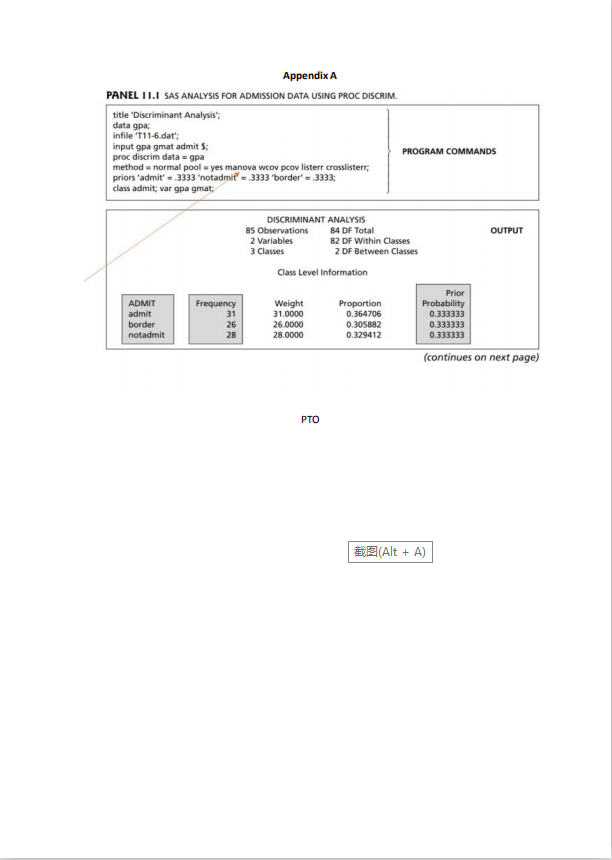
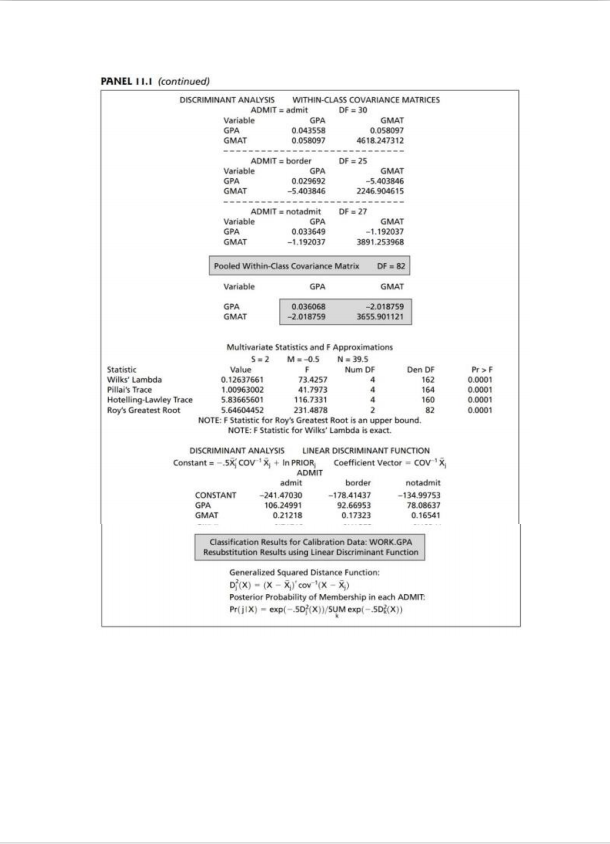
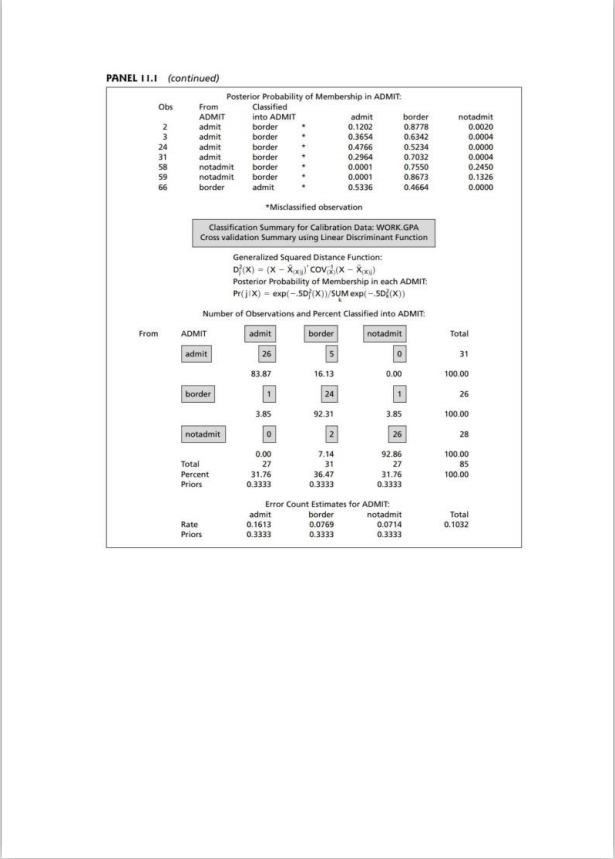
QUESTION 5 The admission officer of a business school has used an "index" of undergraduate grade point average (GPA) and graduate management aptitude test (GMAT) scores to help decide which applicants should be admitted to the school's graduate programs. Figure I shows pairs of x1 = GPA, x2 = GMAT values for groups of recent applicants who have been categorized as 1 : admit: Is: do not admit; my: borderline. From the Table of data given below using SAS we obtain the following summary statistics. 1 31 my =28 My = 26 X1 = 3.40 2.48 2.99 561.23 447.07 446.23 i = 2.97 .0361 -2.0188 488.45 Spooked = 2.0188 3655.9011 (a) What does the MANOVA test procedure perform in PROC DISCRIM in SAS? [b) Interpret the Wilk's Lambda value produced by SAS. (c) Suppose a new applicant has an undergraduate GPA of x: = 3.21 and x2=497. How would this applicant be classified assuming equal prior probabilities? HINT: Use the fact that the inverse of the pooled covariance matrix equals 28.6096 .0158 .0158 .0003 Recall that Di(Xo) = (X0 - X1)'Spooled (No - X1) and similarly for the other groups. [d) What does the LDF function describe? [e) Write out the LDF for each group. (f) What is the Overall error count or rate? g) What is the error rate for each group? (h) Explain what the prior probabilities refer to and give their values. (2 +15 +4+ 2+ 1.5 +0.5 +1 + 0.5 = 13 marks)GMAT 720 A AAAA 540 I'S A AAA C CA 360 A : Admit (1 ) I : Do not admit ( x, ) C : Borderline (1,) 270 2.10 2.40 2.70 3.00 3.30 3.60 3.90 GPA Table 1 1.6 Admission Data for Graduate School of Business Ty: Admit Ty: Do not admit : Borderline Applicant GPA ( *) MAT Applican GPA GMAT Applica GPA GMAT 2.54 2 85 496 3.32 482 2.20 425 474 419 531 3.28 371 30's 2.57 2.35 542 406 2.89 3.15 447 3.50 313 3.19 2.89 402 2 80 485 3.13 414 3.01 416 2.79 471 2.89 291Appendix A PANEL I I.I SAS ANALYSIS FOR ADMISSION DATA USING PROC DISCRIM. title "Discriminant Analysis"; data gpa; infile 'T11-6.dat'; input gpa gmat admit $; proc discrim data = gpa PROGRAM COMMANDS method = normal pool = yes manova wcov pcov listerr crosslisterr, priors 'admit' = 3339 "notadmit = .3333 "border" = .3333; class admit; var gpa grat; DISCRIMINANT ANALYSIS 85 Observations 84 DF Total OUTPUT 2 Variables 82 DF Within Classes 3 Classes 2 DF Between Classes Class Level Information Prior ADMIT Frequency Weight Proportion Probability admit 31 31.0000 0.364706 0.333333 border 26 26.0900 0.305882 0.333333 notadmit 38 28.0000 0.329412 0.333333 (continues on next page) PTO 3(Alt + A)PANEL I L.I (continued) DISCRIMINANT ANALYSIS WITHIN-CLASS COVARIANCE MATRICES ADMIT = admit OF = 30 Variable GPA GMAT GPA 0.043558 0.05409 GMAT 0.058097 46 18. 247312 ADMIT = border OF = 25 Variable GPA GMAT GPA 0.029692 -5.403846 GMAT -5.401846 2246.904615 ADMIT = notadmit OF = 27 Variable GPA GMAT GPA 0.033649 -1.192037 GMAT -1.192037 3891.253968 Pooled Within-Class Covariance Matrix DF = 82 Variable GPA GMAT GPA 0.036068 -2.018759 GMAT -2.018759 3655.901121 Multivariate Statistics and F Approximations 5-2 M.-0.5 N = 39.5 Statistic Value F Num OF Den DF Pr sF Wilks' Lambda 0.12637661 73.4257 162 0.0001 Pillal's Trace 1.00963002 41.7973 164 0.0001 Hotelling-Lawley Trace 5.83665601 116.7331 160 0.0001 Roy's Greatest Root 5.64604452 231.4878 82 0.0001 NOTE: F Statistic for Roy's Greatest Root is an upper bound. NOTE: F Statistic for Wilks' Lambda is exact. DISCRIMINANT ANALYSIS LINEAR DISCRIMINANT FUNCTION Constant = -5X cov 'x + In PRIOR Coefficient Vector = cov 'x ADMIT admit border notadmit CONSTANT -241.47030 -178.41437 -134.99753 GPA 106.24991 92.66953 78.08637 GMAT 0.21218 0.17323 0.16541 Classification Results for Calibration Data: WORK. GPA Resubstitution Results using Linear Discriminant Function Generalized Squared Distance Function: D (X) - (X - X)' cov '(x - x) Posterior Probability of Membership in each ADMIT: Prij(X) = exp(--50 (X))/SUM exp(-.50;(X))PANEL II.1 (continued) Posterior Probability of Membership in ADMIT: Obs From Classified ADMIT into ADMIT admit border notadmit admit border 0.1202 0.8778 0.0020 admit border 0.3654 0.6342 0.0904 admit border 0.4766 0.5234 0.0000 31 admit border 0.2964 0.7032 0.0004 58 notadmit border 0.0001 0.7550 0.2450 59 notadmit border 0.0001 0.8673 0.1326 border admit 0.5336 0.4664 0.0000 *Misclassified observation Classification Summary for Calibration Data: WORK GPA Cross validation Summary using Linear Discriminant Function Generalized Squared Distance Function: D (X) = (X - Xx )'COV(X - Xx) Posterior Probability of Membership in each ADMIT: Pr(]IX) = exp(-.50 (X))/SUM exp(-.501(X)) Number of Observations and Percent Classified into ADMIT: From ADMIT admit border notadmit Total admit 26 31 83.87 16.13 OLO 100.00 border 1 24 1 26 185 92.31 3.8 100.00 notadmit 0 2 26 100 7.14 32.86 100.00 Total 27 31 27 85 Percent 31.76 36.47 31.76 100.00 Priors 0.9030 0.3333 Error Count Estimates for ADMIT: admit border notadmit Total Rate 0.1613 0.0769 0.0714 0.1032 Priors FEEFO FEEED
Step by Step Solution
There are 3 Steps involved in it

Get step-by-step solutions from verified subject matter experts