

Question: Question 5 Given the demand and forecast values shown in the table below, Period Demand Forecast June 495 484 July 515 506 August 519 528
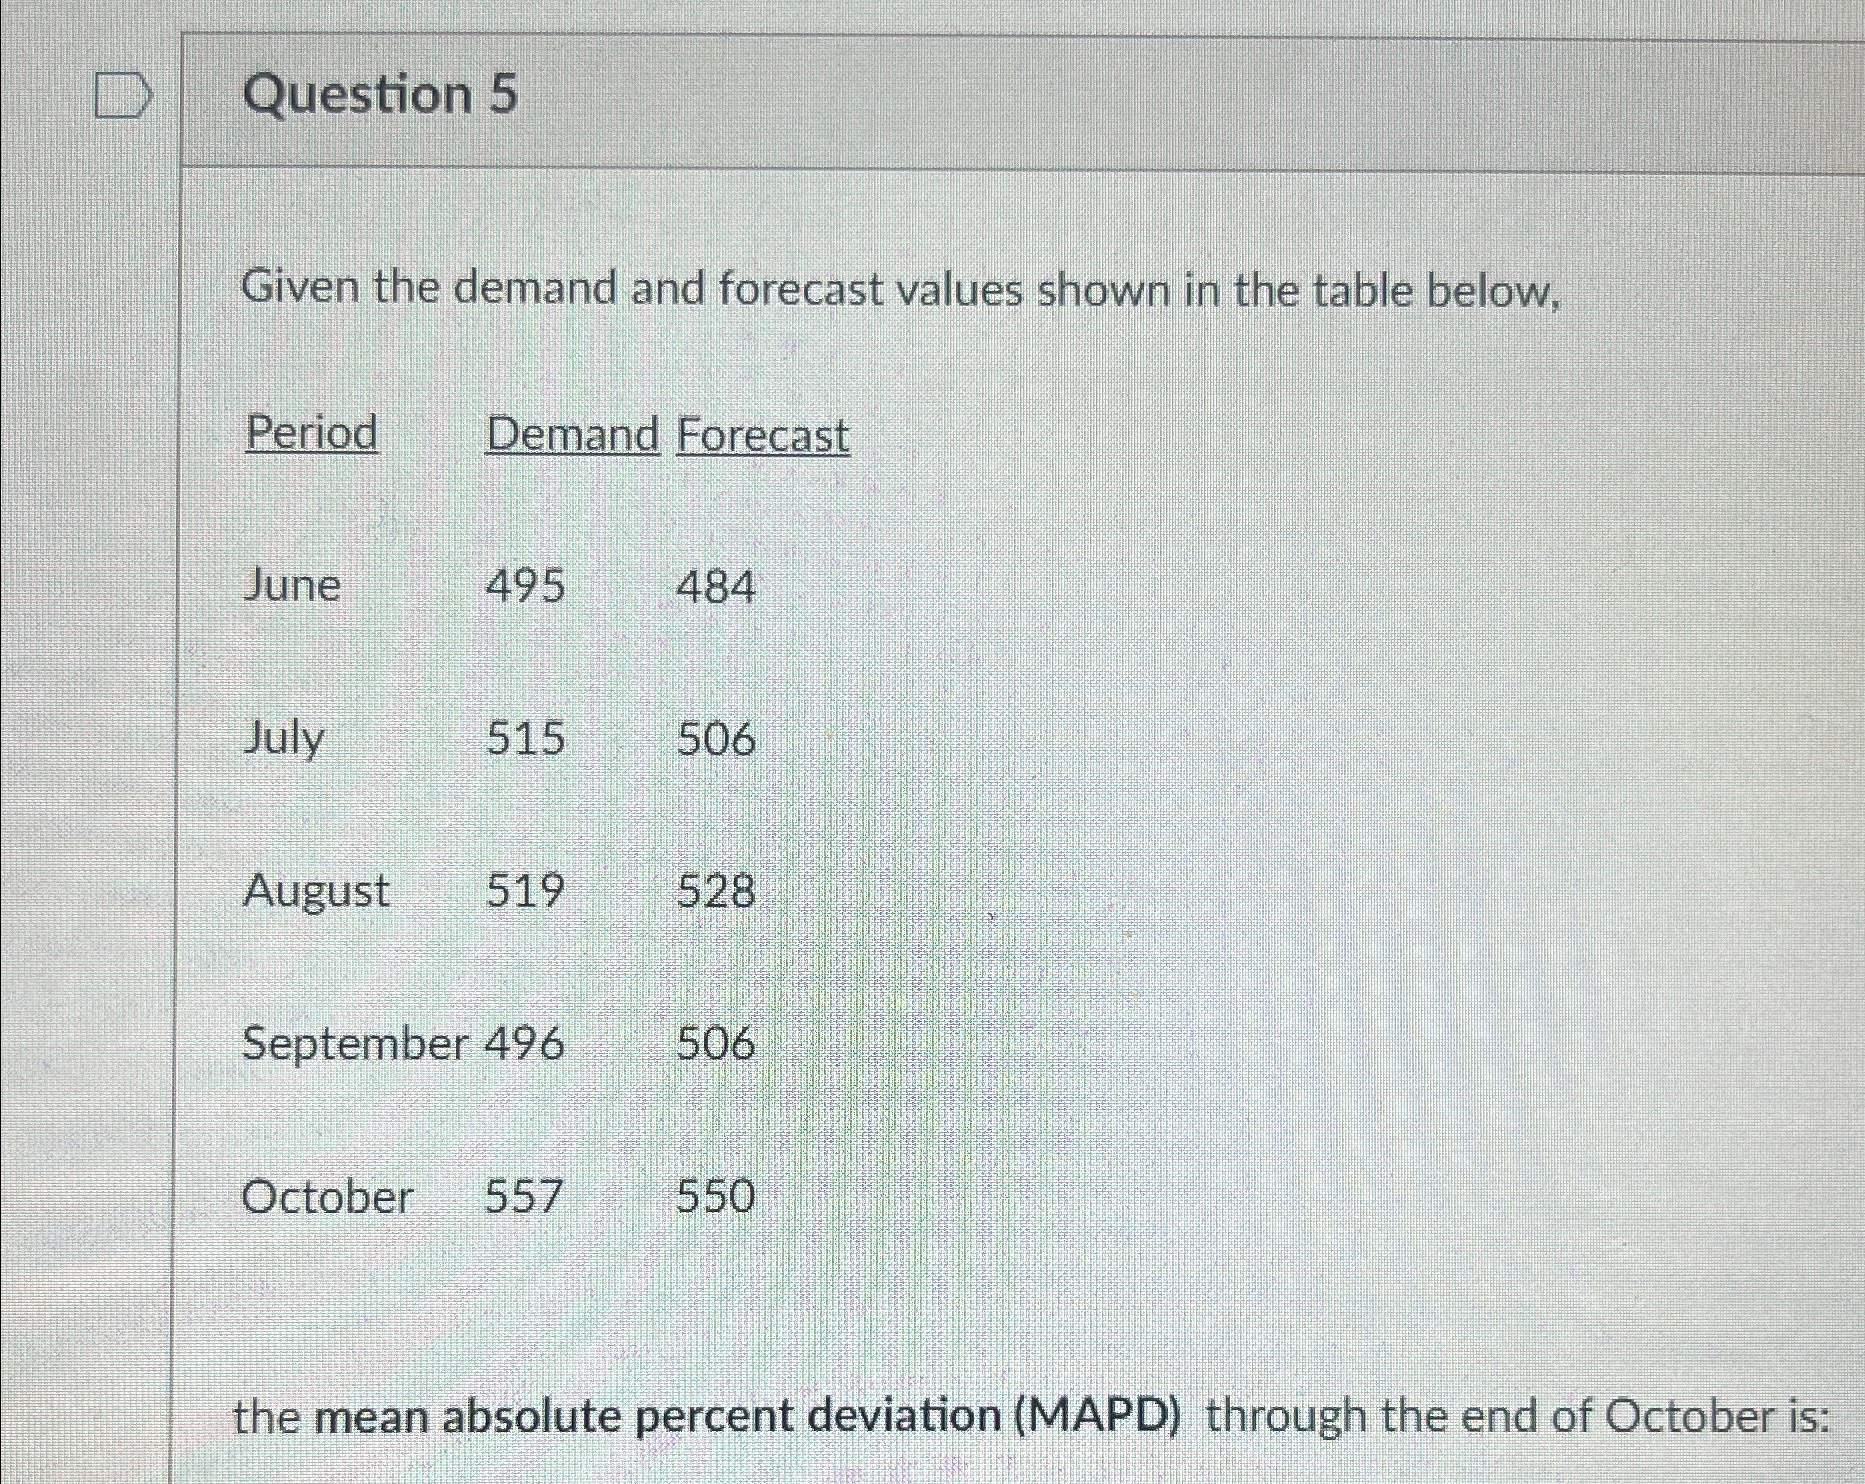
Question 5 Given the demand and forecast values shown in the table below, Period Demand Forecast June 495 484 July 515 506 August 519 528 September 496 506 October 557 550 the mean absolute percent deviation (MAPD) through the end of October is
Step by Step Solution
There are 3 Steps involved in it
1 Expert Approved Answer
Step: 1 Unlock

Question Has Been Solved by an Expert!
Get step-by-step solutions from verified subject matter experts
Step: 2 Unlock
Step: 3 Unlock