

Question: Given the following information 1. The linear regression trend line equation for the de-seasonlized data (Unadjusted): Ft - 149+4t 2. Seasonality Index table Period
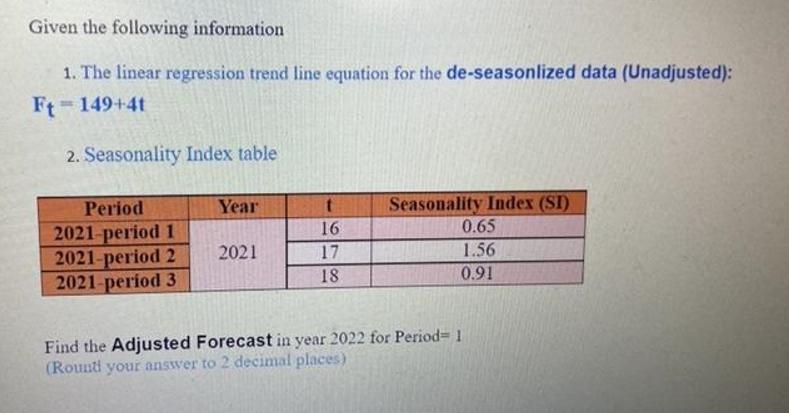
Given the following information 1. The linear regression trend line equation for the de-seasonlized data (Unadjusted): Ft - 149+4t 2. Seasonality Index table Period Year t Seasonality Index (SI) 0.65 2021-period 1 16 2021-period 2 2021 17 1.56 2021-period 3 18 0.91 Find the Adjusted Forecast in year 2022 for Period= 1 (Round your answer to 2 decimal places)
Step by Step Solution
There are 3 Steps involved in it
1 Expert Approved Answer
Step: 1 Unlock

Criver Period unadjusted forecast 213 3 18 Ft 1494 149 4 16 for period I 1 14964 213 ft 149 68 ... View full answer
Question Has Been Solved by an Expert!
Get step-by-step solutions from verified subject matter experts
Step: 2 Unlock
Step: 3 Unlock