

Question: Question 5 > Graphing Linear Functions by plotting points. Complete the table below for the function = 3x+4. Then use two of the ordered
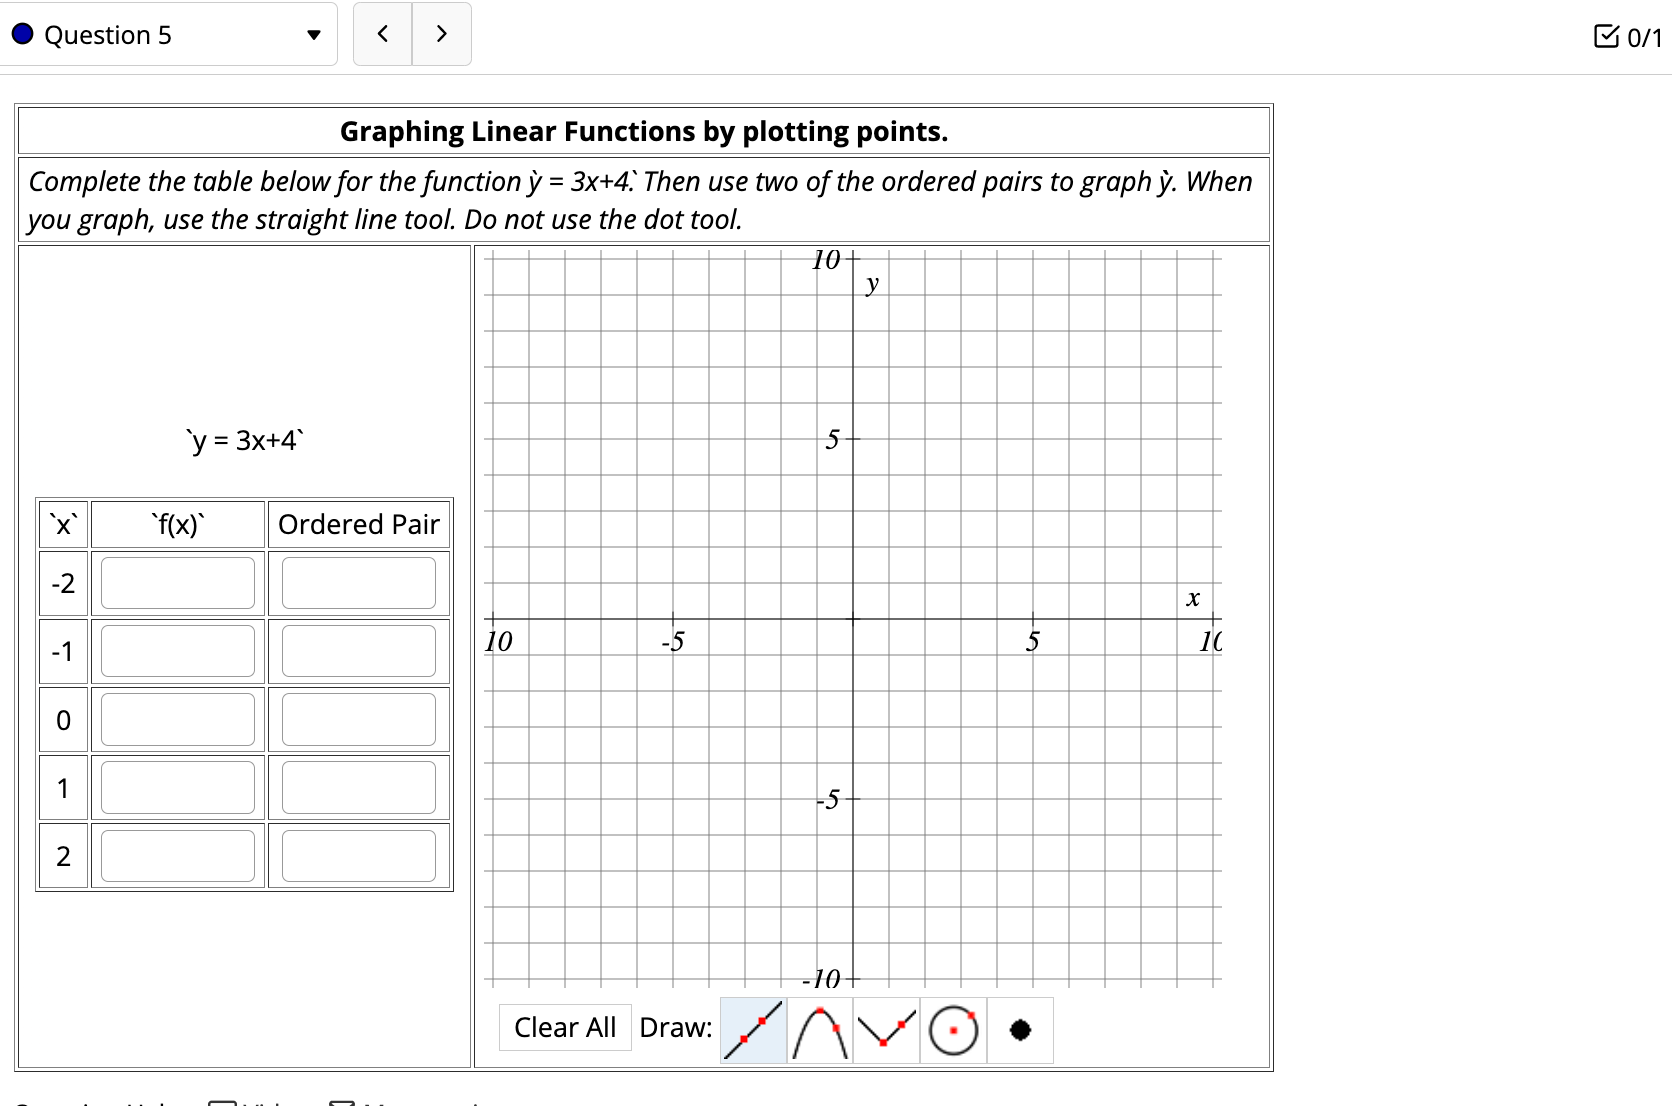
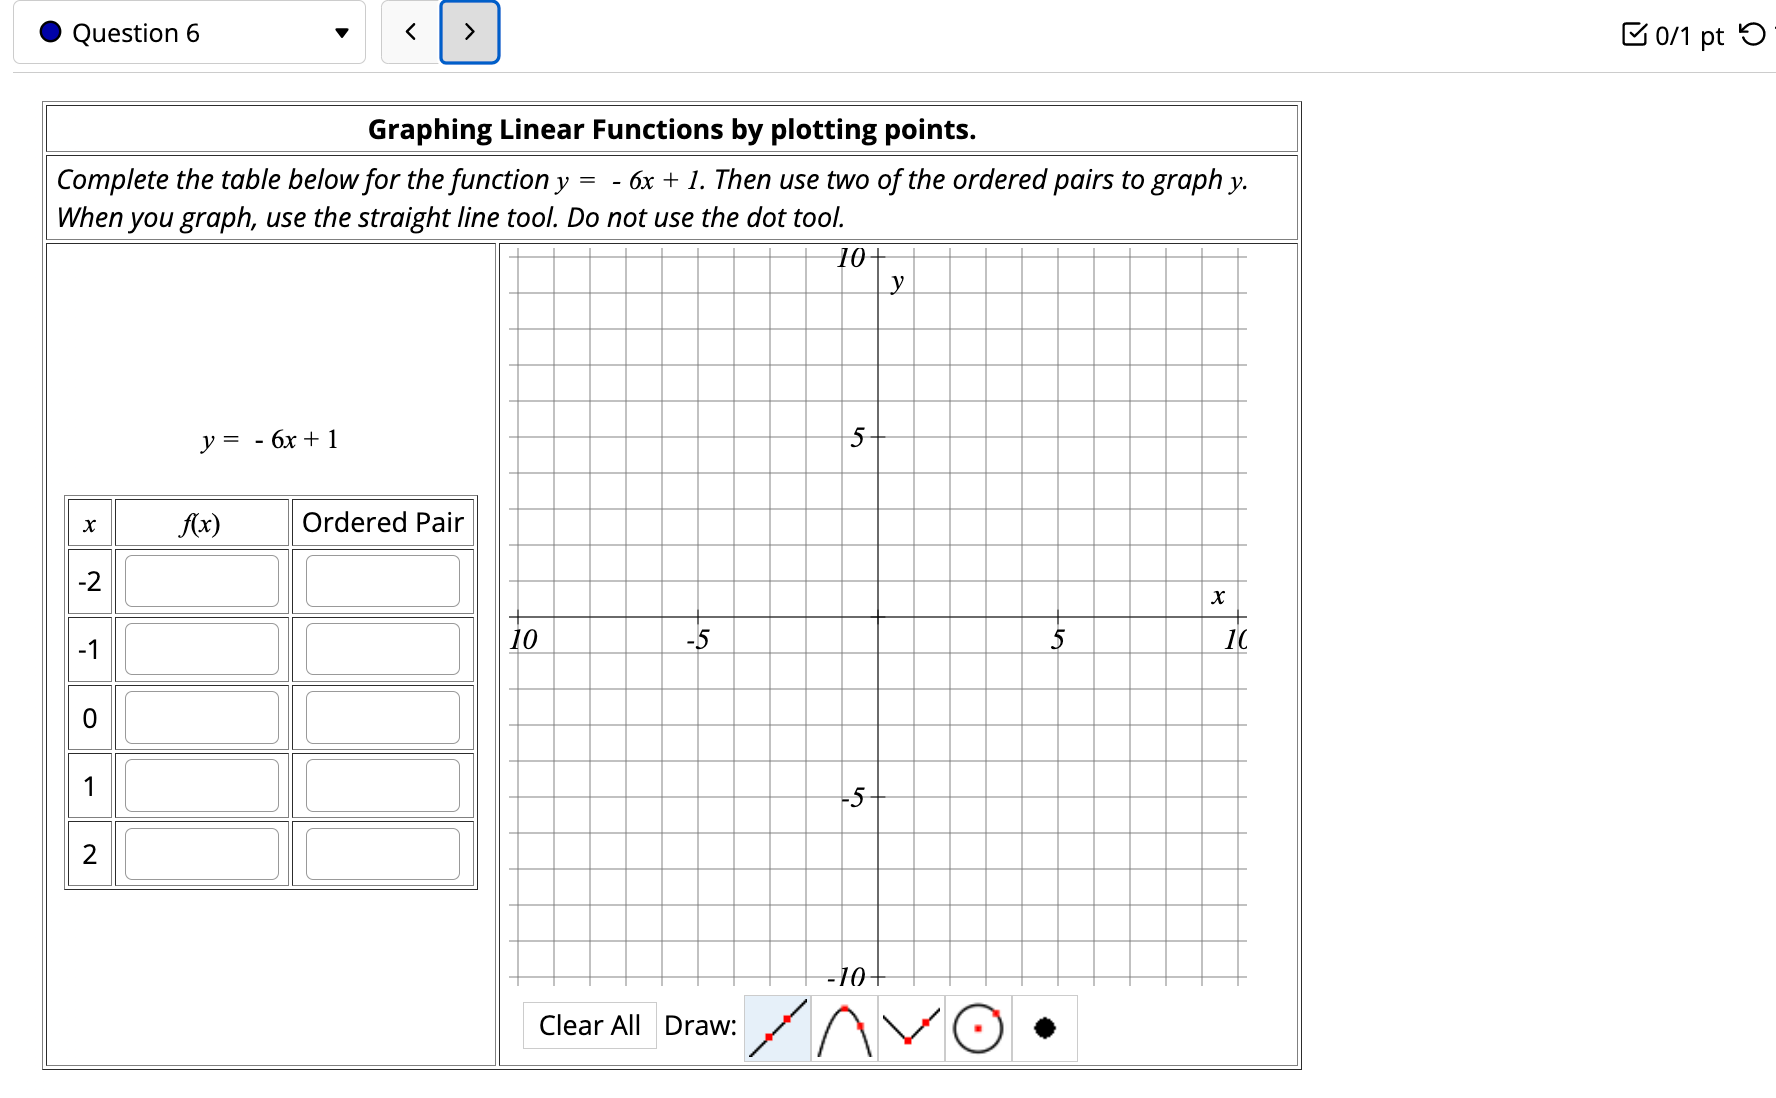
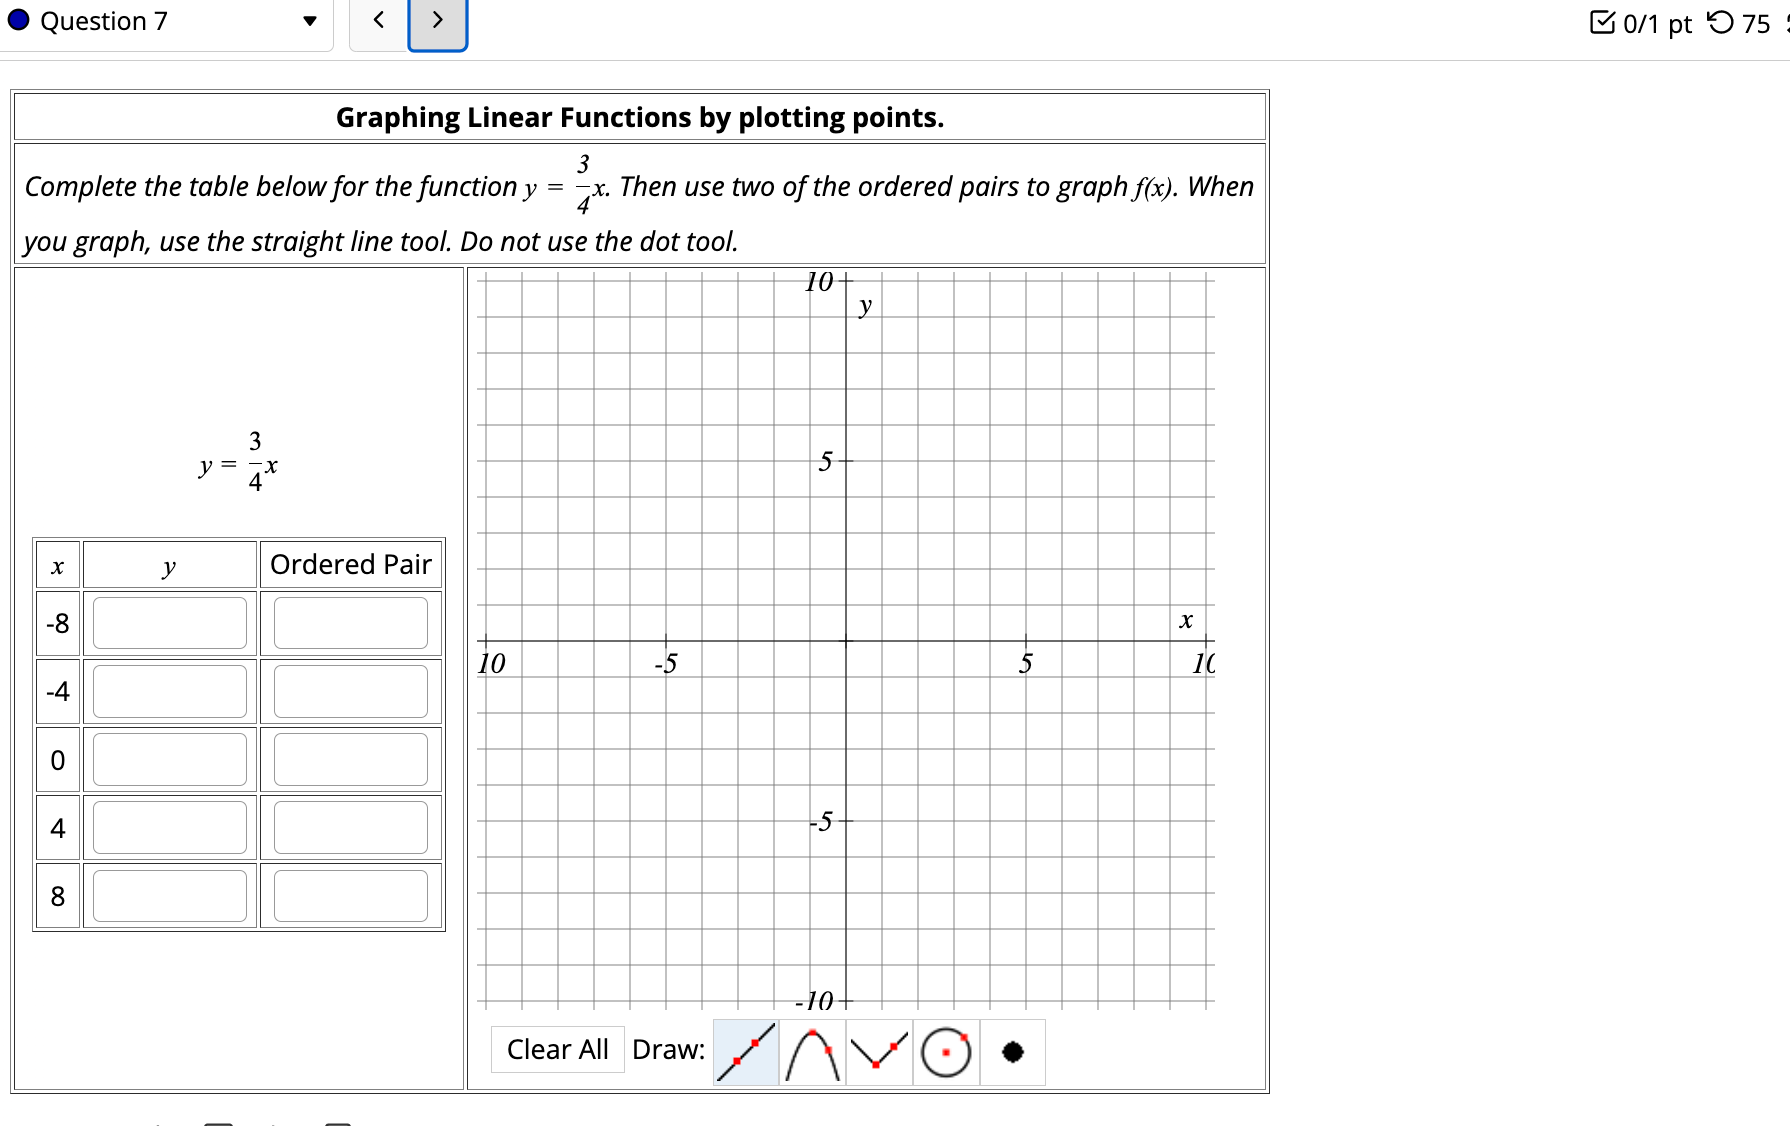
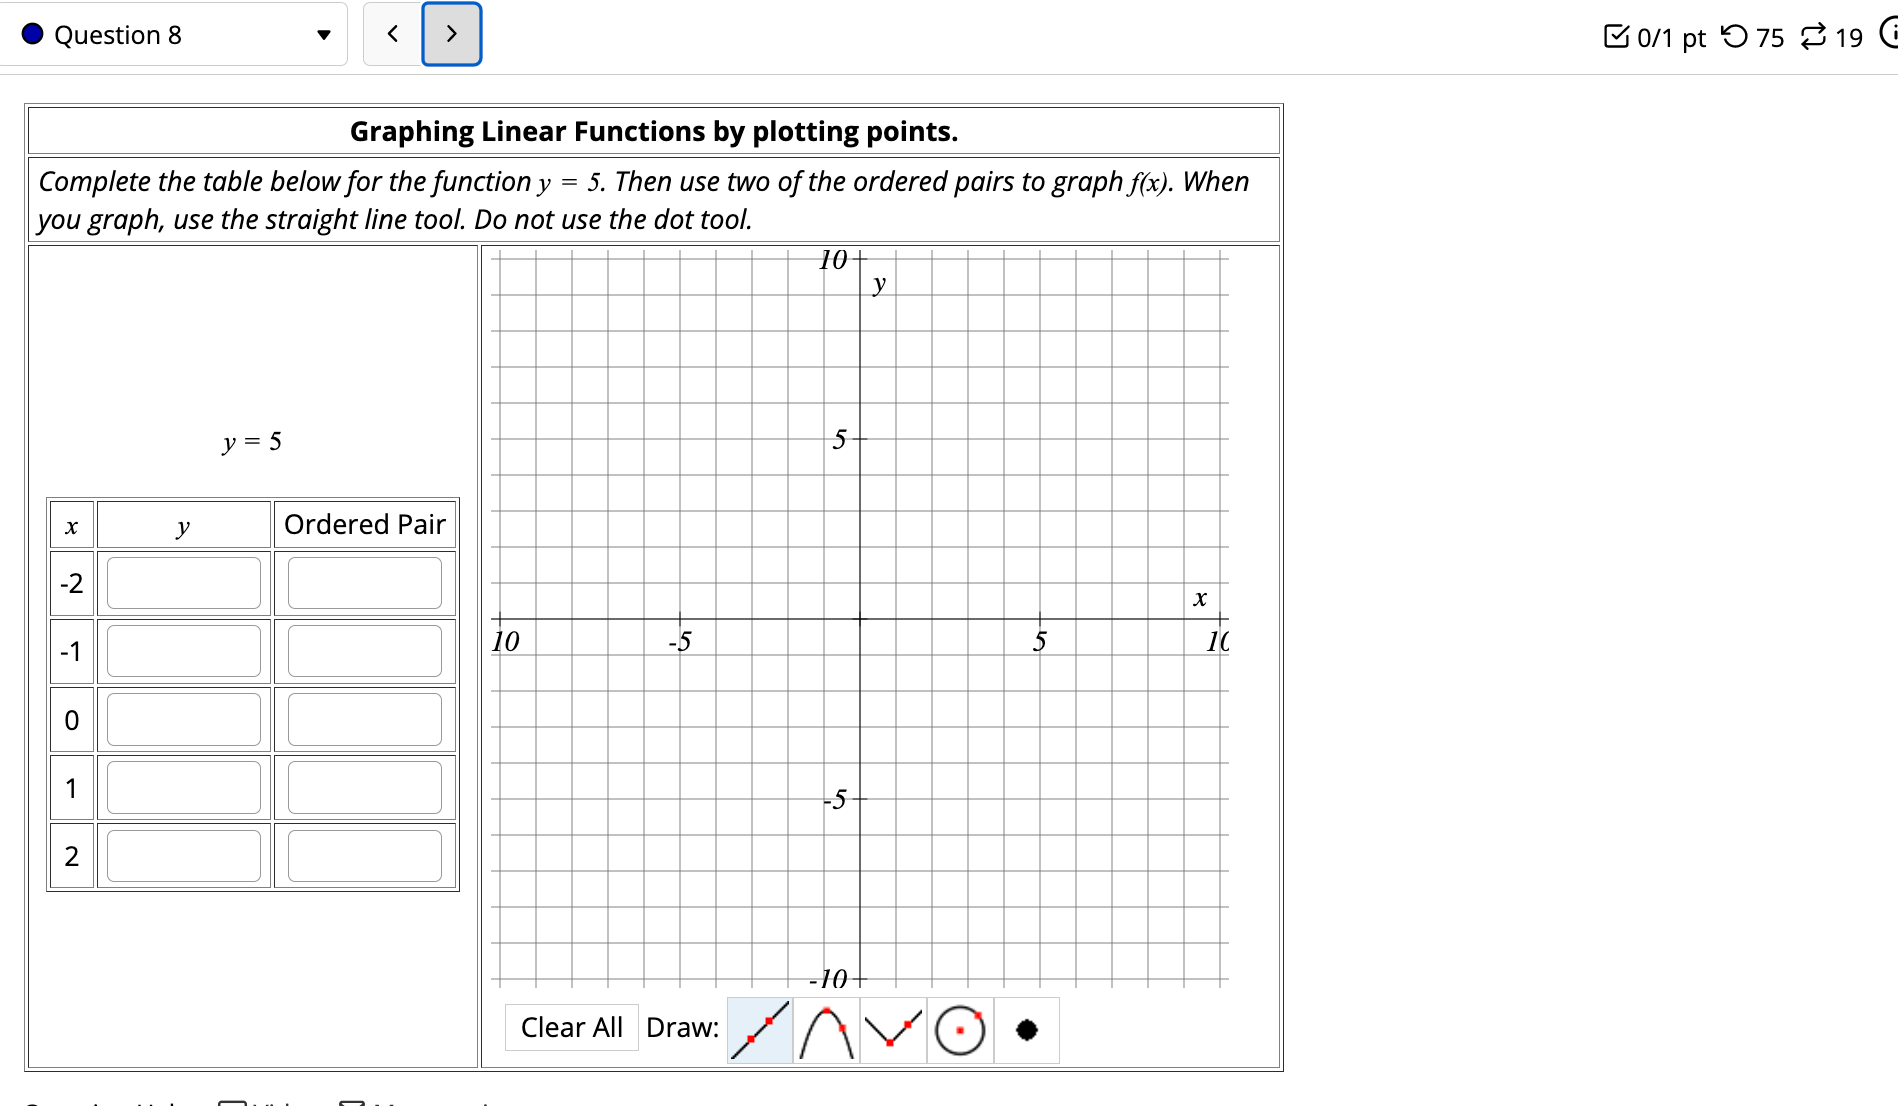
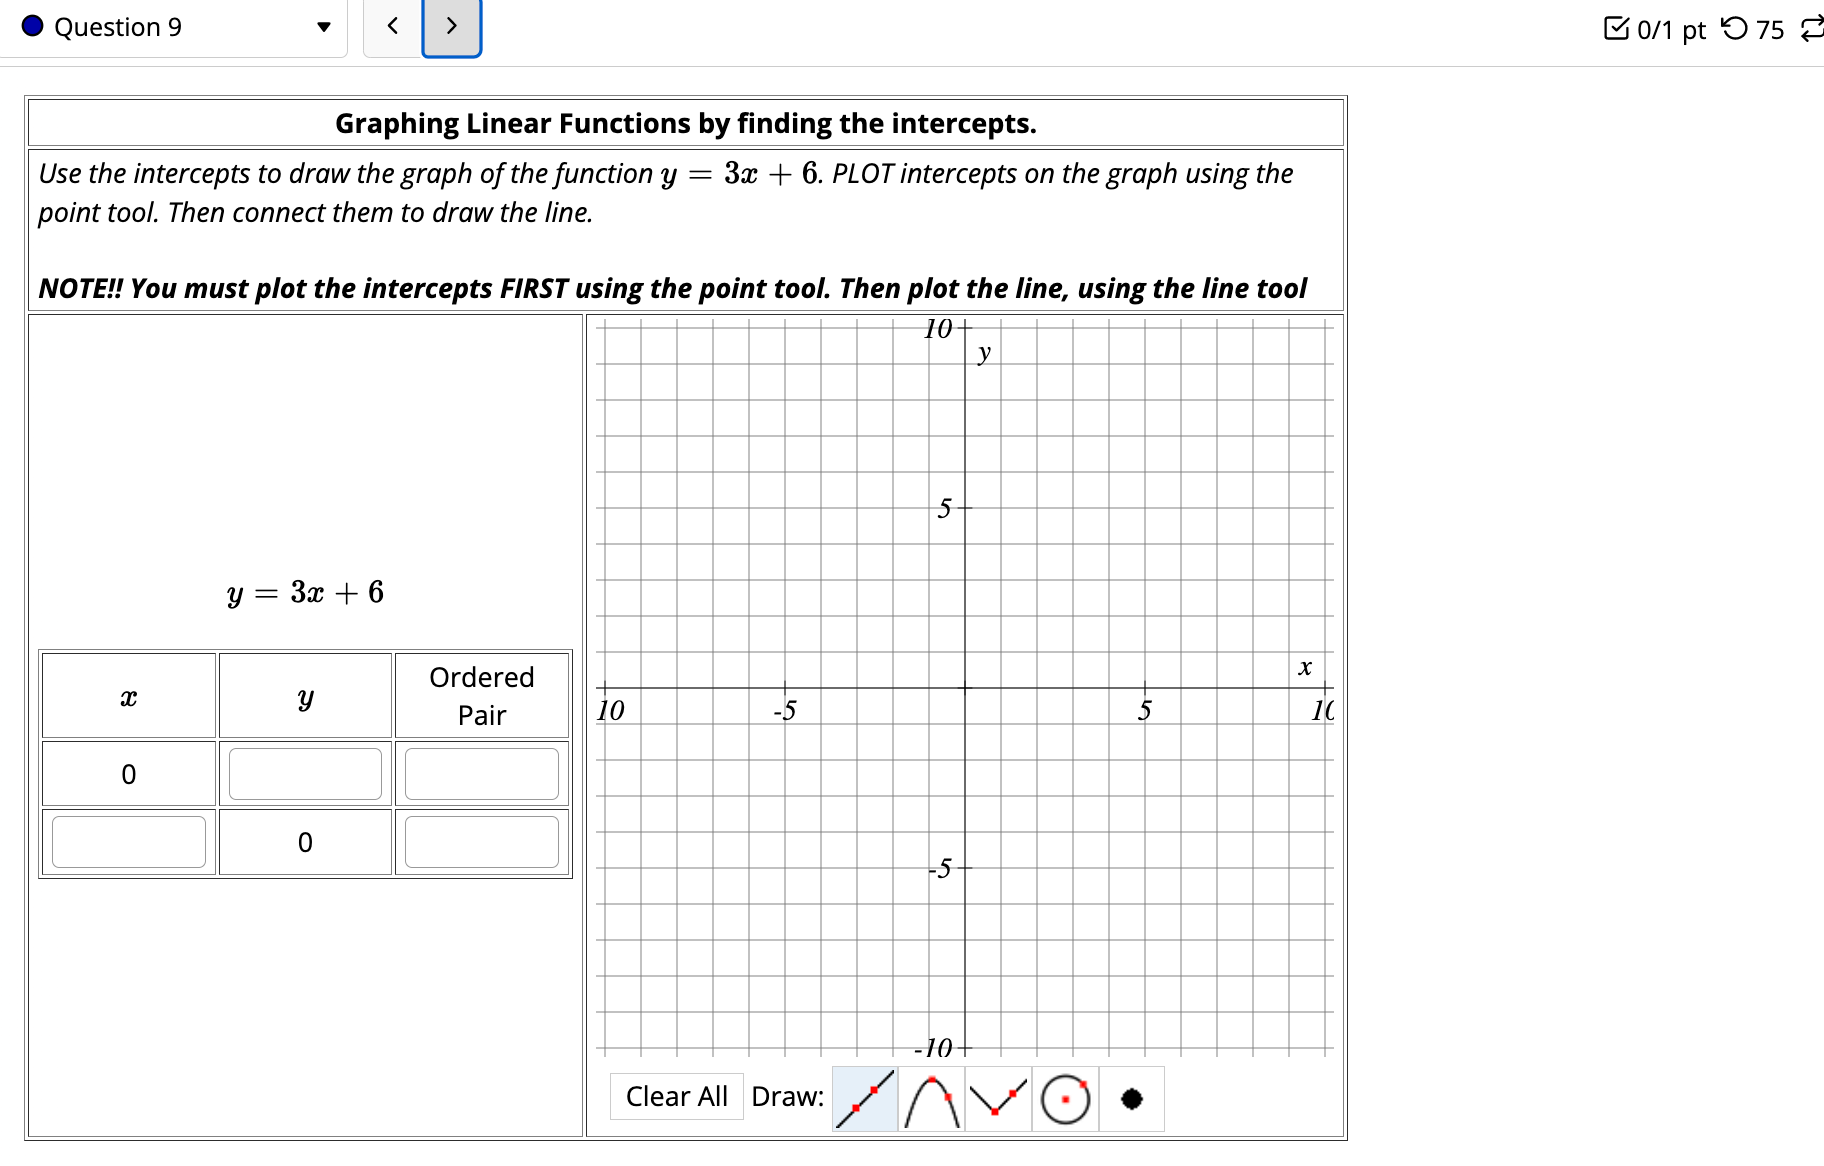
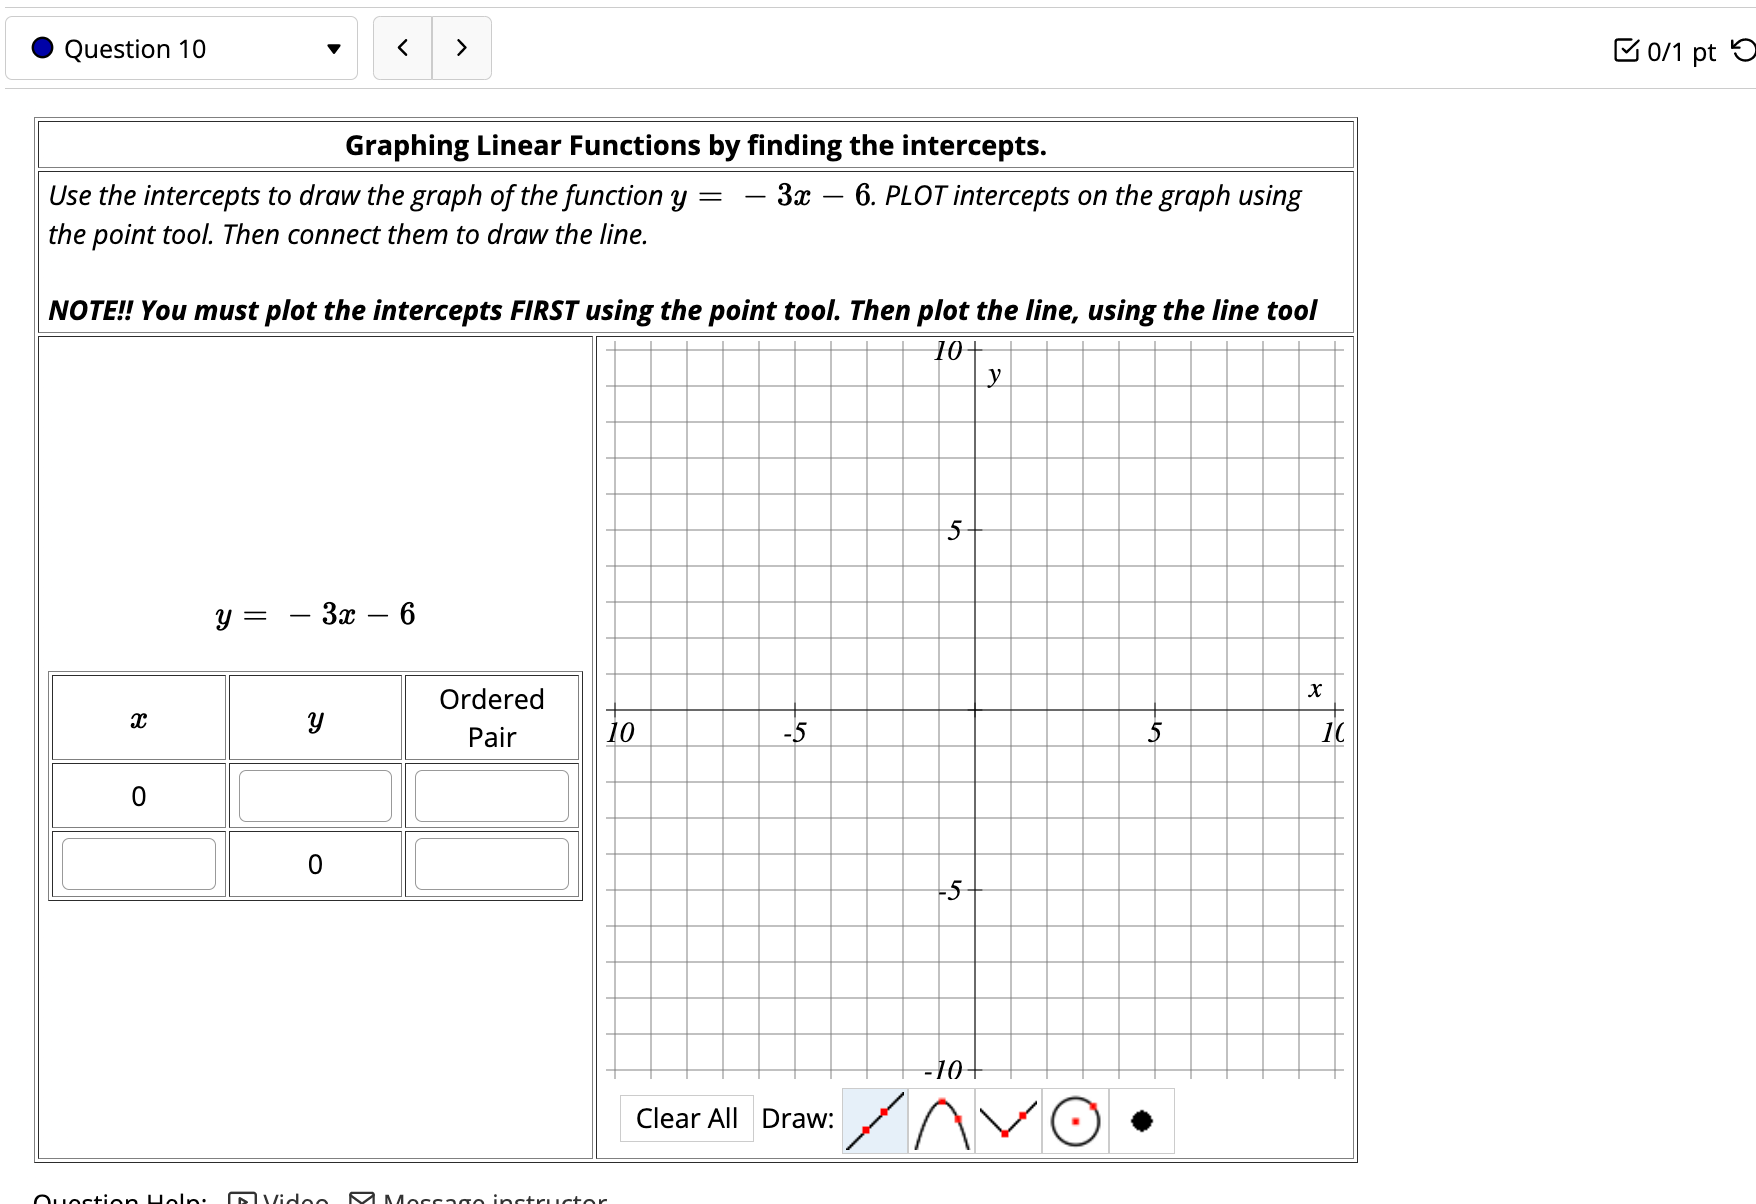
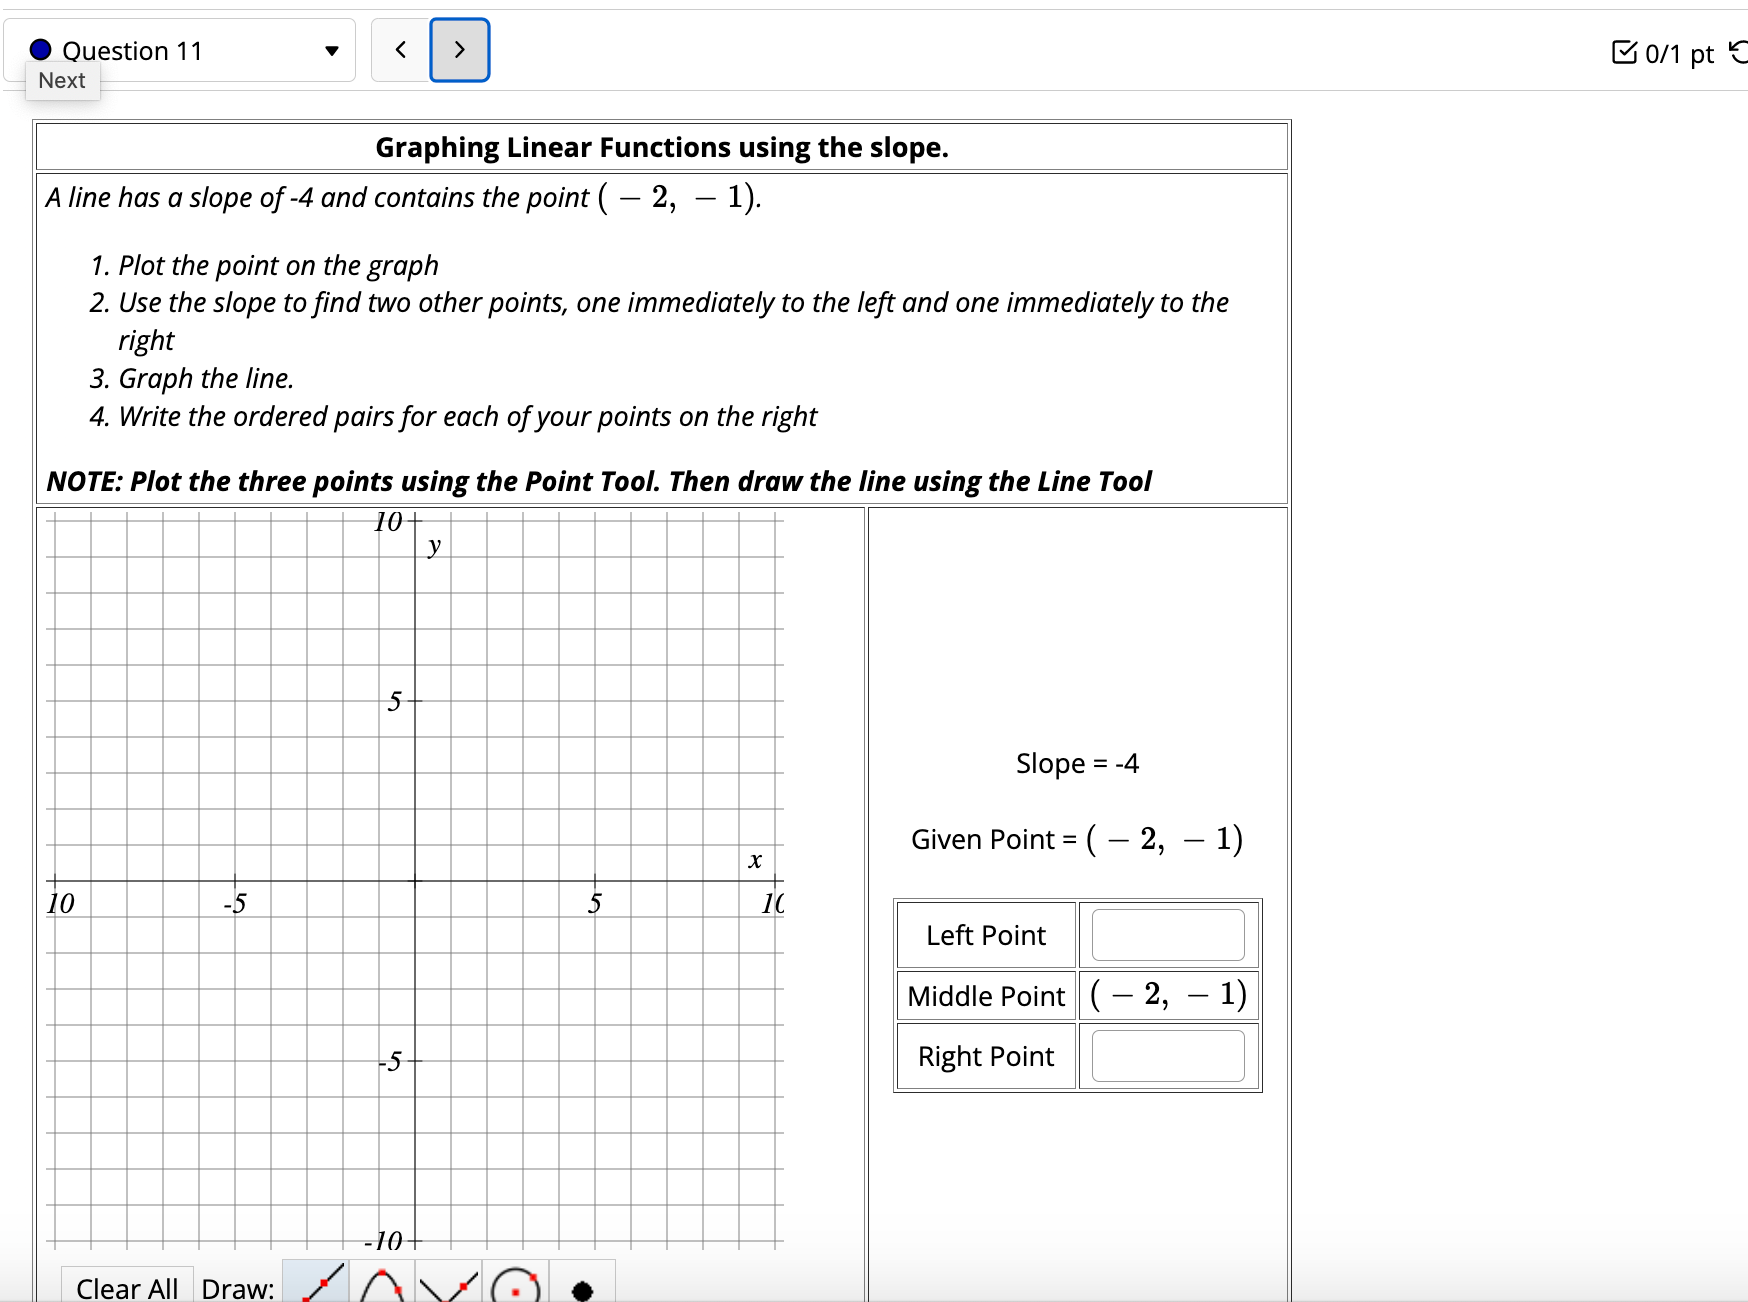
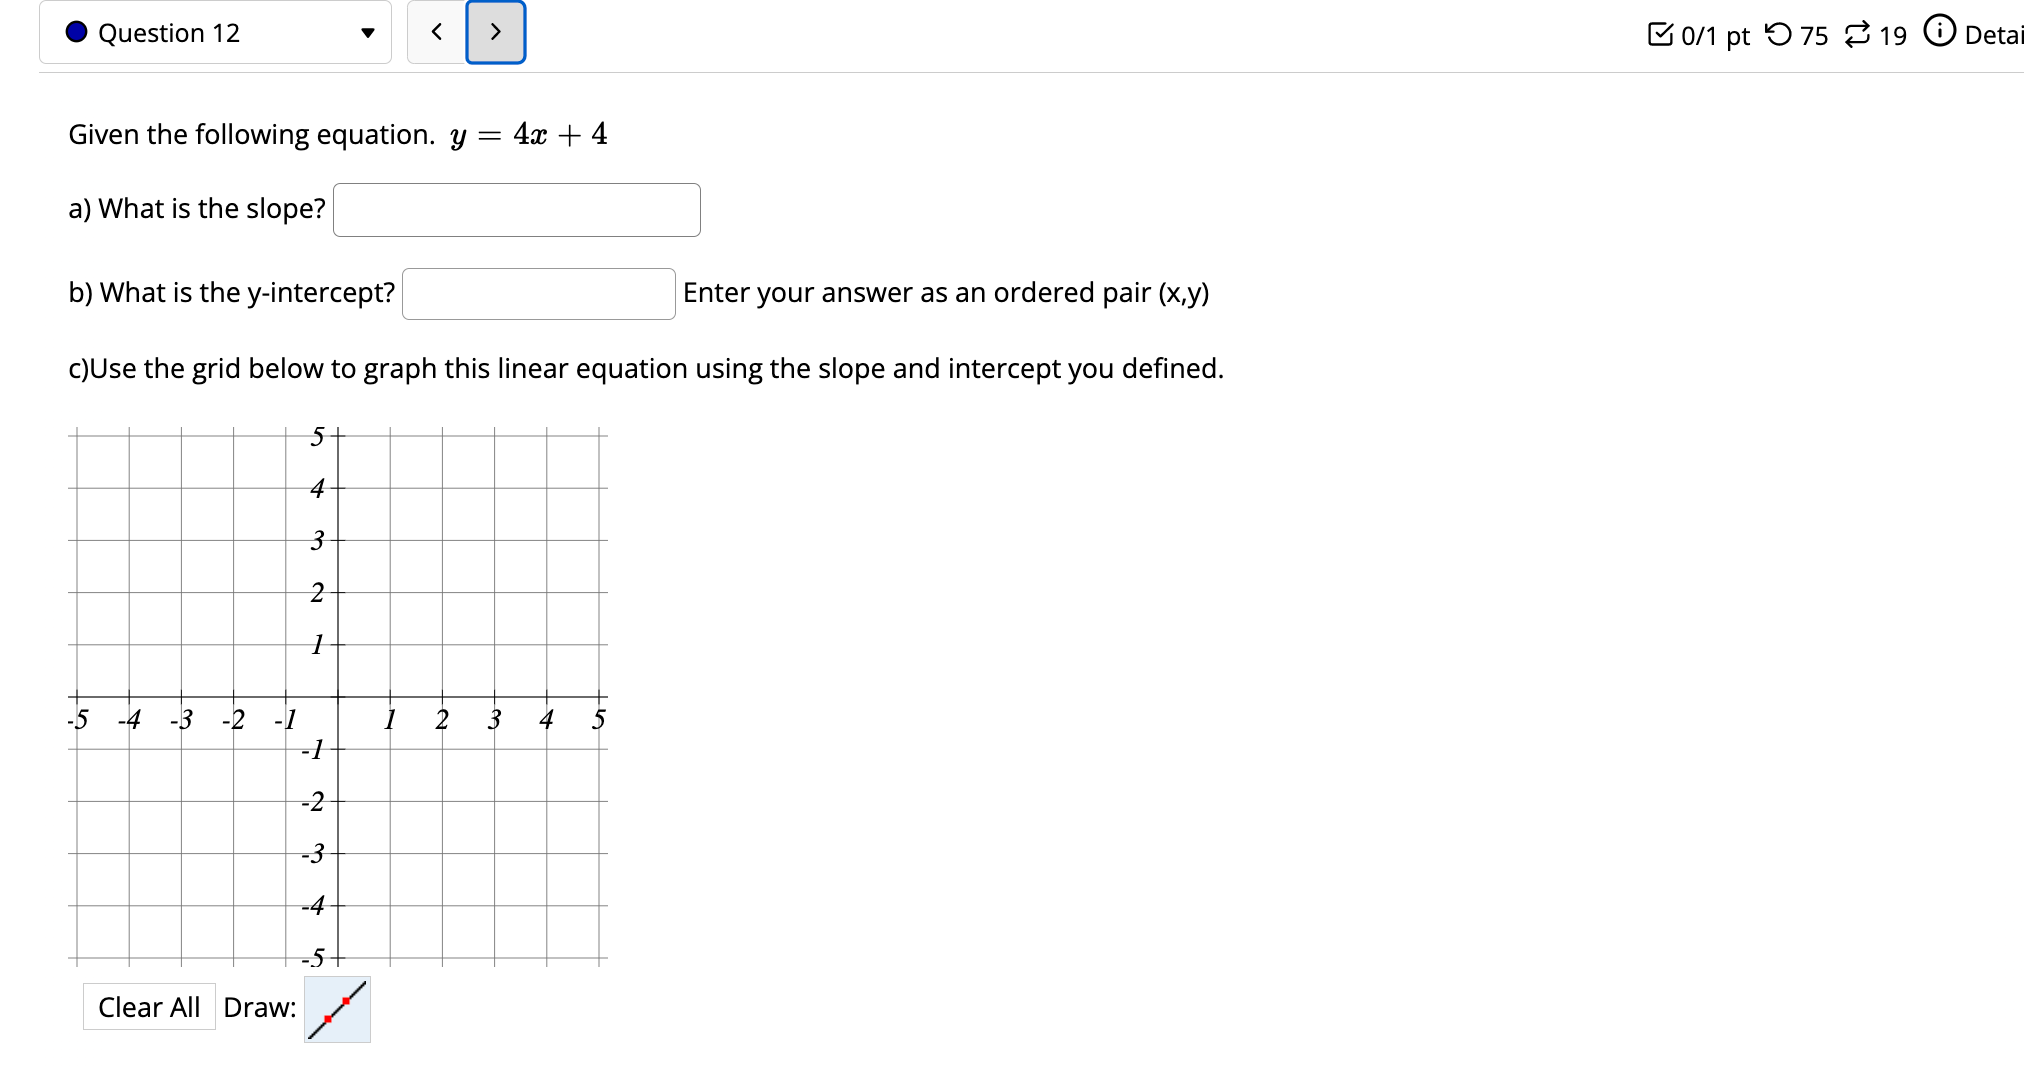
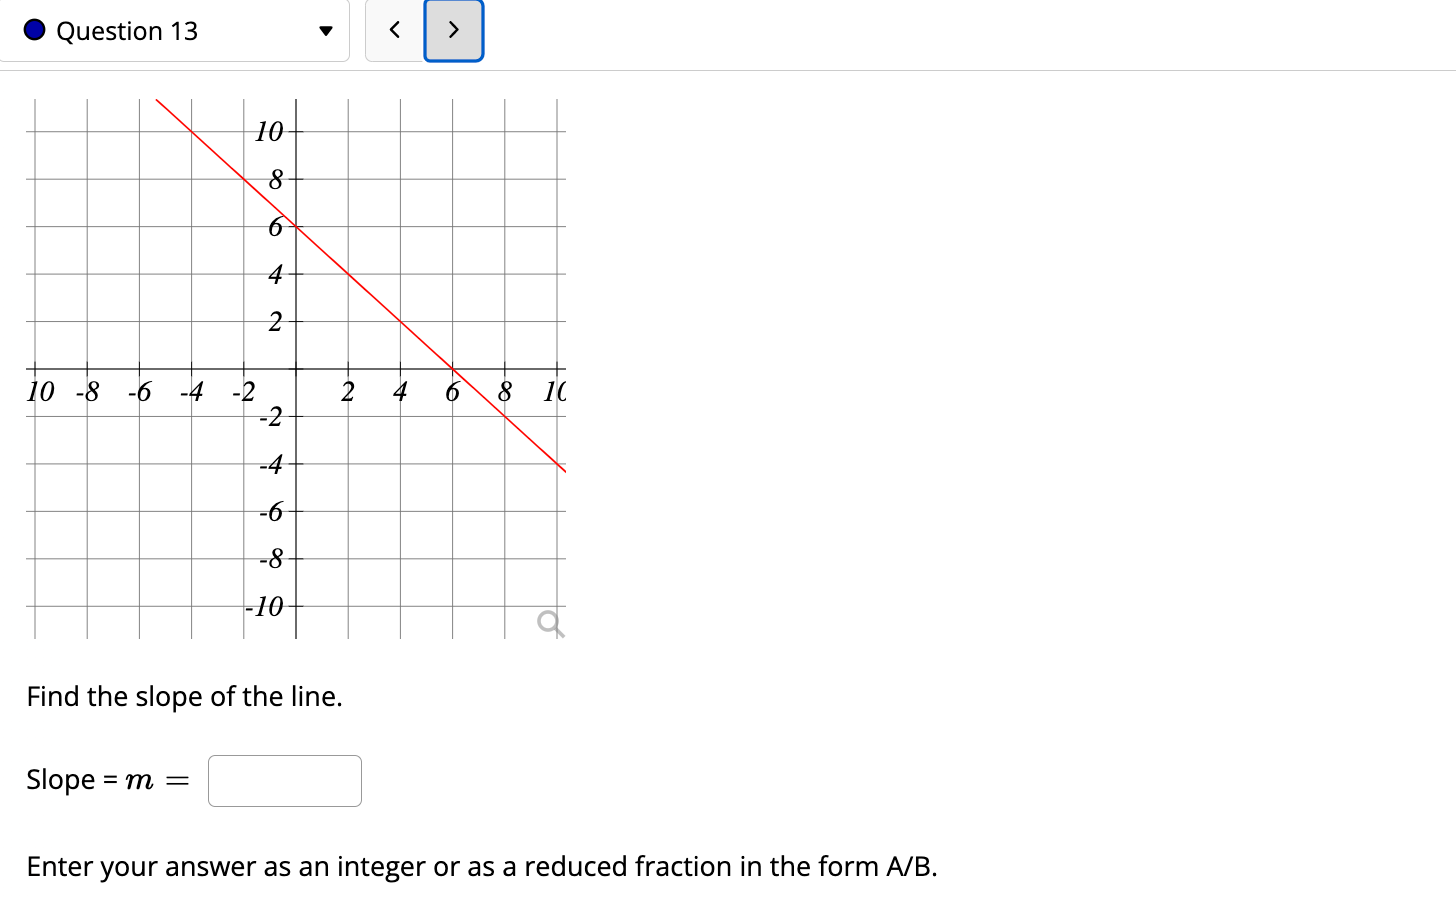
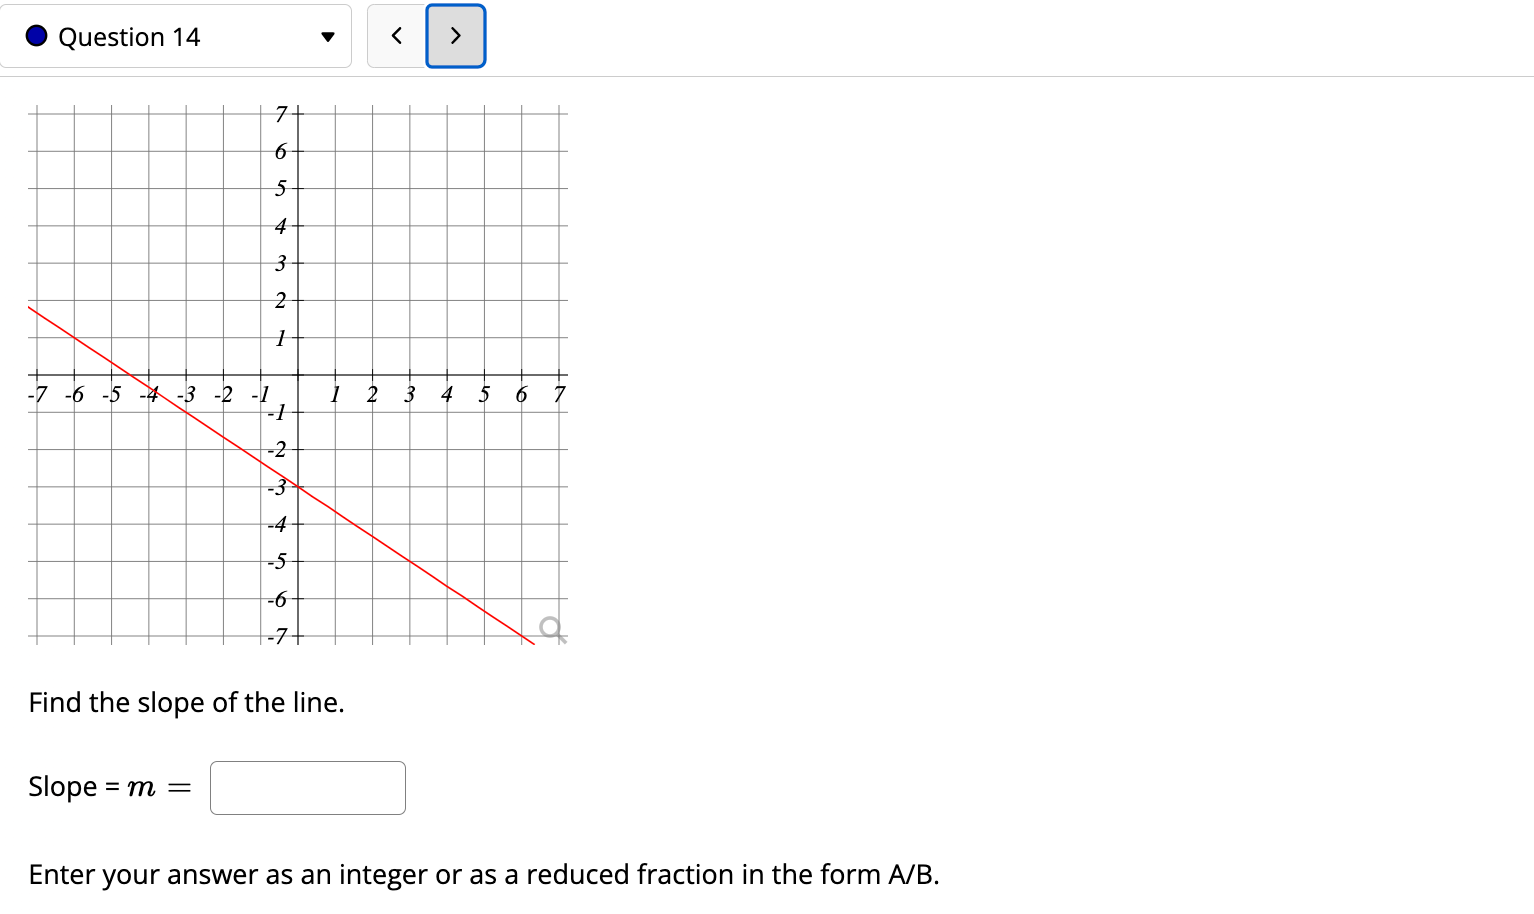
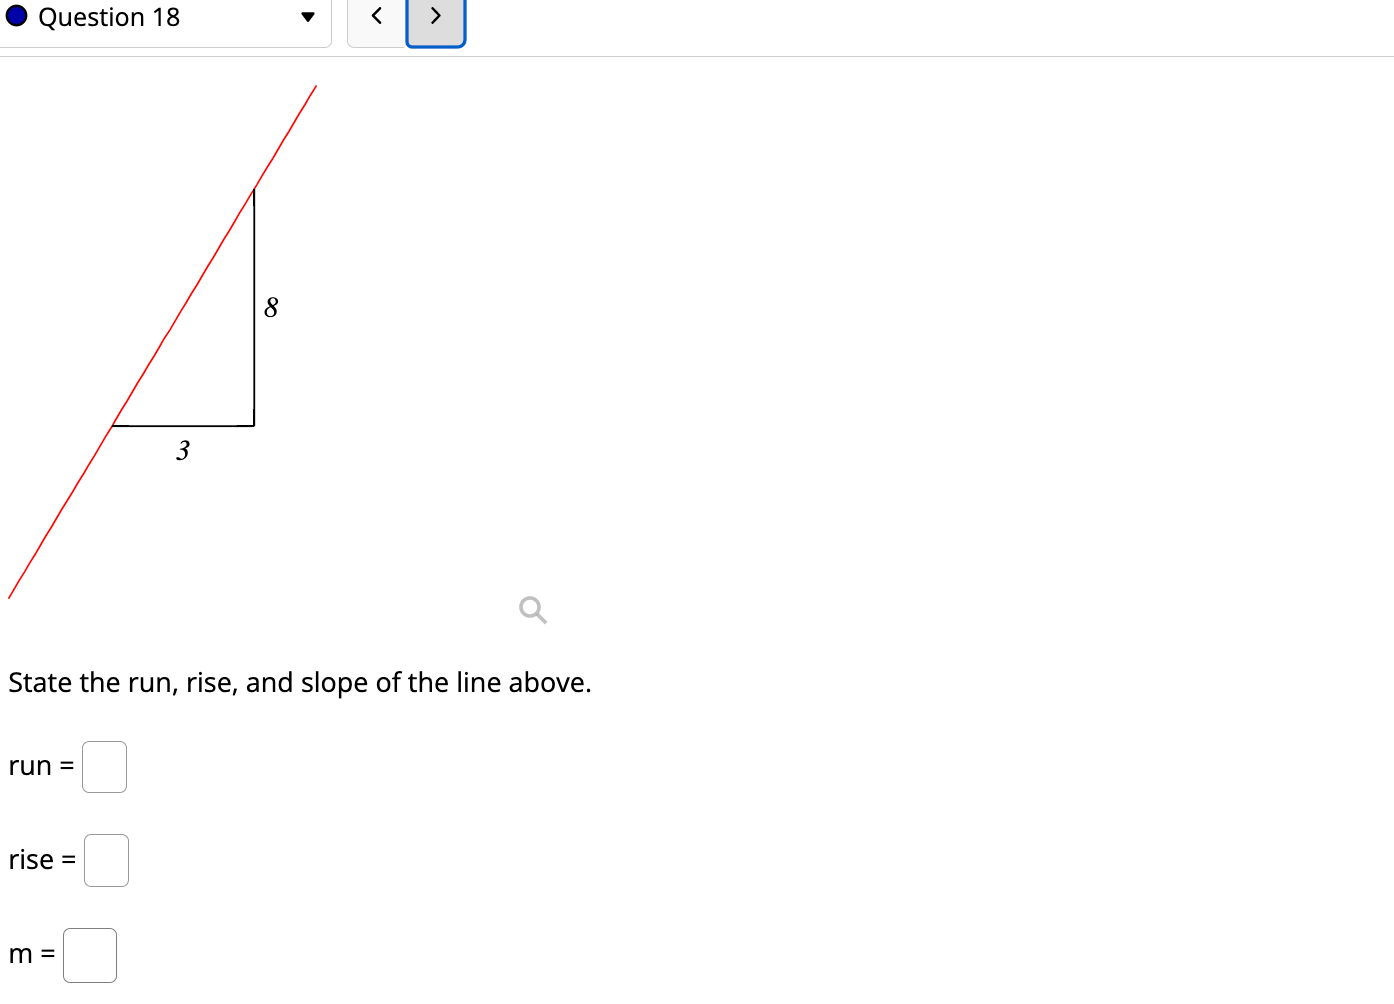
Question 5 > Graphing Linear Functions by plotting points. Complete the table below for the function = 3x+4. Then use two of the ordered pairs to graph . When you graph, use the straight line tool. Do not use the dot tool. ``y=3x+4` `f(x)` Ordered Pair -2 -1 1 2 10 -5 Clear All Draw: 10- y 5 -5 -10+ 5 x 10 0/1 Question 6 < > Graphing Linear Functions by plotting points. Complete the table below for the function y - 6x + 1. Then use two of the ordered pairs to graph y. When you graph, use the straight line tool. Do not use the dot tool. N 0 1 2 y = -6x+1 f(x) Ordered Pair 10 -5 Clear All Draw: 10 y 5 -5 -10+ 5 x 10 0/1 pt Question 7 < > Graphing Linear Functions by plotting points. 3 Complete the table below for the function y = 7x. Then use two of the ordered pairs to graph f(x). When you graph, use the straight line tool. Do not use the dot tool. 3 y = x x y Ordered Pair -8 -4 0 4 8 10 -5 10+ y 5 5 Clear All Draw: -10+ 5 x 10 0/1 pt 75 Question 8 < > Graphing Linear Functions by plotting points. = Complete the table below for the function y 5. Then use two of the ordered pairs to graph f(x). When you graph, use the straight line tool. Do not use the dot tool. * N = 1 N y = 5 y Ordered Pair 10 -5 10- y 5 -5 -10+ : Clear All Draw: 5 x 10 0/1 pt 7519 C Question 9 > Graphing Linear Functions by finding the intercepts. Use the intercepts to draw the graph of the function y point tool. Then connect them to draw the line. = 3x 6. PLOT intercepts on the graph using the NOTE!! You must plot the intercepts FIRST using the point tool. Then plot the line, using the line tool 8 y = 3x + 6 Ordered Pair 10 -5 Clear All Draw: -5 -10+ 10+ y S 5 x 10 0/1 pt 75 Question 10 < > Graphing Linear Functions by finding the intercepts. Use the intercepts to draw the graph of the function y the point tool. Then connect them to draw the line. = - - 3x - 6. PLOT intercepts on the graph using NOTE!! You must plot the intercepts FIRST using the point tool. Then plot the line, using the line tool y = 3x - 6 Ordered 8 Pair 10 -5 0 Question Help: Video Message instructor. 10+ y 5 -5 -10+ Clear All Draw: 5 x 10 0/1 pt Question 11 Next Graphing Linear Functions using the slope. A line has a slope of -4 and contains the point ( 2, 1). 1. Plot the point on the graph - 2. Use the slope to find two other points, one immediately to the left and one immediately to the right 3. Graph the line. 4. Write the ordered pairs for each of your points on the right NOTE: Plot the three points using the Point Tool. Then draw the line using the Line Tool 10+ y 10 -5 5 5 Clear All Draw: -10+ x 5 10 Slope = -4 Given Point = ( 2, 1) Left Point Middle Point (-2, 1) Right Point 0/1 pt Question 12 < > Given the following equation. y = 4x + 4 a) What is the slope? b) What is the y-intercept? Enter your answer as an ordered pair (x,y) c)Use the grid below to graph this linear equation using the slope and intercept you defined. 5 4 3 2 1 -5 -4 -3 -2 -1 2 3 4 5 -1 -2 -3 -4 -5 Clear All Draw: 0/1 pt 7519 Detail Question 13 D 10 8 10 6 4 < > 2 10 -8 -6 -4 -2 2 4 68 10 -4 24 -6 -8 -10 Find the slope of the line. Slope = m = Enter your answer as an integer or as a reduced fraction in the form A/B. Question 14 7+ 6 < > 4 3 2 1 -7-6-5-4-3-2-1 1 2 3 4 5 6 7 -1 -2- -3 -4 -5 -6 -7+ 67 Find the slope of the line. Slope = m = Enter your answer as an integer or as a reduced fraction in the form A/B. Question 18 3 8 ^ State the run, rise, and slope of the line above. run = rise = m =
Step by Step Solution
There are 3 Steps involved in it

Get step-by-step solutions from verified subject matter experts