

Question: Question 5 (Joint distribution and Conditional distribution) (12 point) The following table gives the joint probability distribution between employment status and college graduation among those
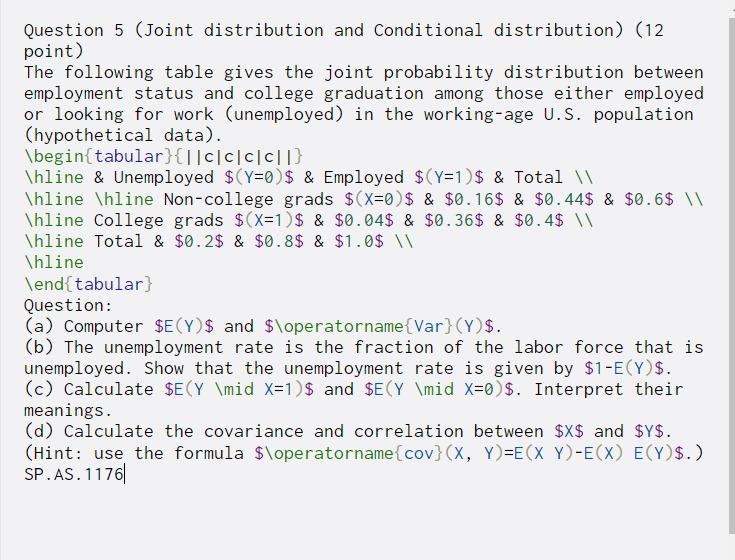
Question 5 (Joint distribution and Conditional distribution) (12 point) The following table gives the joint probability distribution between employment status and college graduation among those either employed or looking for work (unemployed) in the working-age U.S. population (hypothetical data). \begin{tabular}{||CC|CC||} \hline & Unemployed $(Y=0)$ & Employed $(Y=1) $ & Total \hline \hline Non-college grads $(X=0) $ & $0.16$ & $0.44$ & $0.6$ W \hline College grads $(x=1 $ & $0.04$ & $0.36$ & $0.4$ \hline Total & $0.2$ & $0.8$ & $1.0$ W \hline \end{tabular Question: (a) Computer $E(Y)$ and $\operatorname{Var}(Y)$. (b) The unemployment rate is the fraction of the labor force that is unemployed. Show that the unemployment rate is given by $1-E(Y)$. (c) Calculate $E(Y \mid X=1 $ and $E(Y \mid X=0)$. Interpret their meanings. (d) Calculate the covariance and correlation between $X$ and $y$. (Hint: use the formula $\operatorname{cov}(X, Y)=E(XY)-E(X) E(Y)$.) SP.AS. 11761
Step by Step Solution
There are 3 Steps involved in it

Get step-by-step solutions from verified subject matter experts