

Question: QUESTION 5 Note that this exercise replicates Section 5.3 in Stock and Watson, but with the MA data instead of CA data. Hence, it
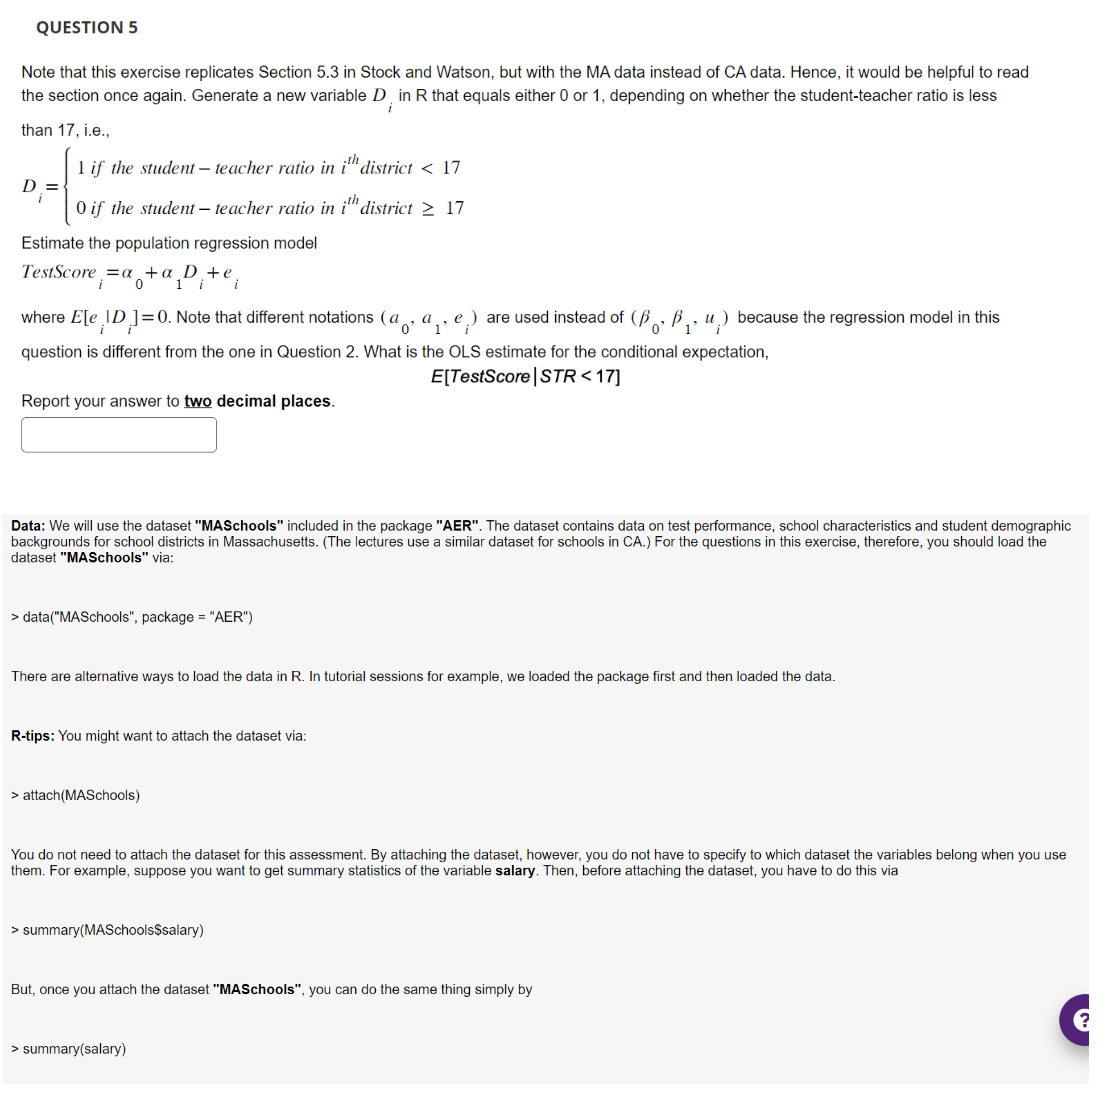
QUESTION 5 Note that this exercise replicates Section 5.3 in Stock and Watson, but with the MA data instead of CA data. Hence, it would be helpful to read the section once again. Generate a new variable D. in R that equals either 0 or 1, depending on whether the student-teacher ratio is less than 17, i.e., 1 if the student-teacher ratio in ith district < 17 D O if the student-teacher ratio in ith district 17 Estimate the population regression model TestScore =a+a D+e 01 ii where E[e ID]=0. Note that different notations (a, a, e) are used instead of (Bo, B, u.) because the regression model in this question is different from the one in Question 2. What is the OLS estimate for the conditional expectation, Report your answer to two decimal places. E[TestScore | STR data("MASchools", package = "AER") There are alternative ways to load the data in R. In tutorial sessions for example, we loaded the package first and then loaded the data. R-tips: You might want to attach the dataset via: > attach(MASchools) You do not need to attach the dataset for this assessment. By attaching the dataset, however, you do not have to specify to which dataset the variables belong when you use them. For example, suppose you want to get summary statistics of the variable salary. Then, before attaching the dataset, you have to do this via > summary(MASchools$salary) But, once you attach the dataset "MASchools", you can do the same thing simply by > summary(salary) ?
Step by Step Solution
There are 3 Steps involved in it

Get step-by-step solutions from verified subject matter experts