

Question: question 5 part 1&2 needed problem 13 needed Problem 5 Intro The following table shows historical beginning-of-year prices for a stock and the sum of
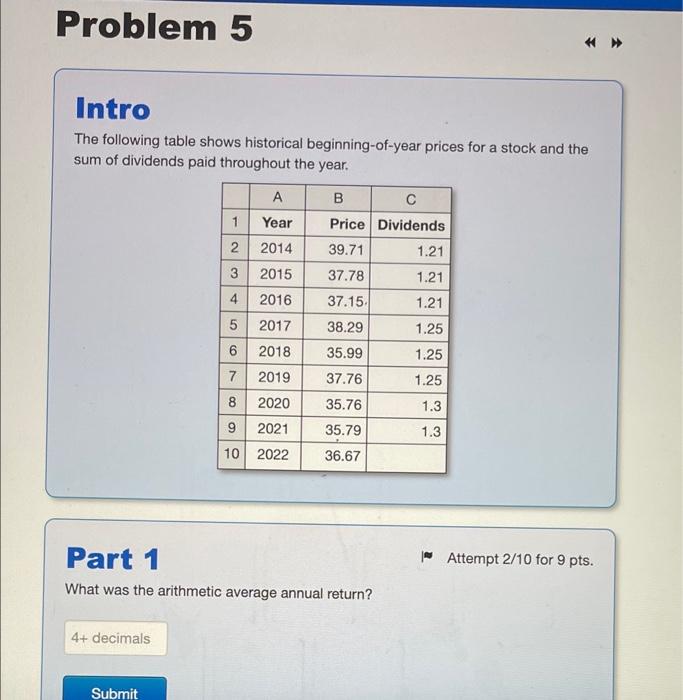
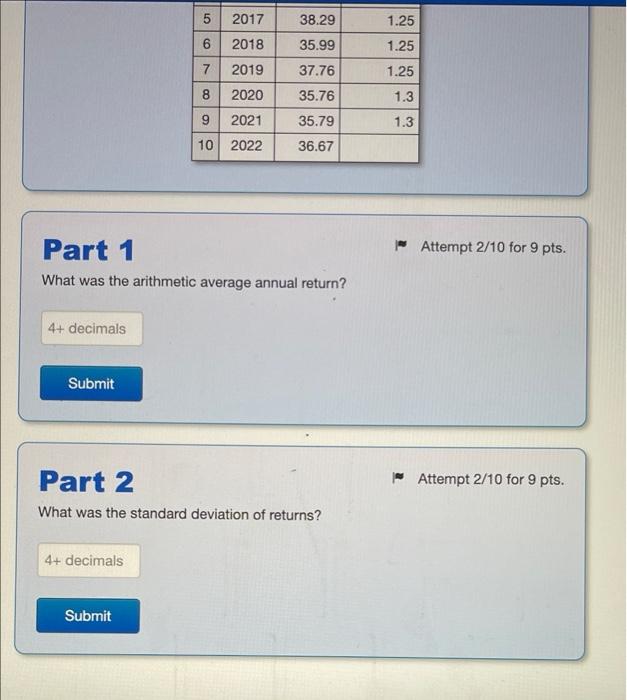
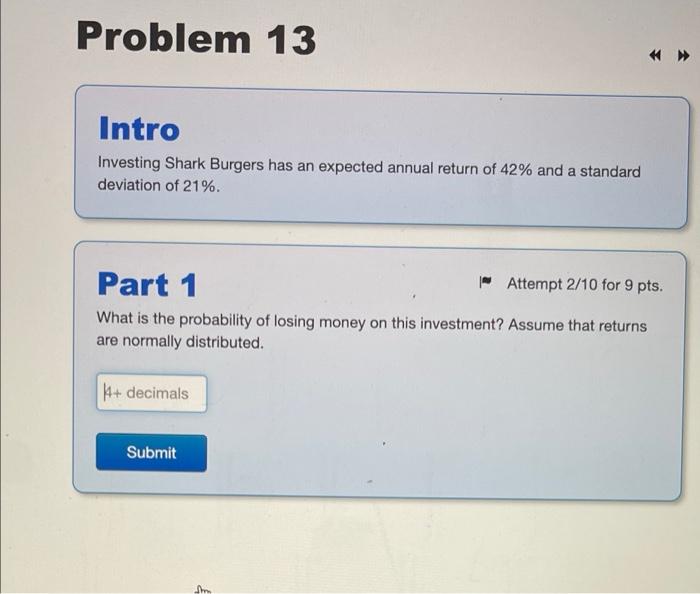
Problem 5 Intro The following table shows historical beginning-of-year prices for a stock and the sum of dividends paid throughout the year. A 1 Year B Price Dividends 39.71 1.21 37.78 1.21 37.15 1.21 38.29 1.25 2 2014 3 2015 4. 2016 5 2017 6 2018 7 2019 8 2020 92021 10 2022 35.99 1.25 7 37.76 1.25 35.76 1.3 1.3 35.79 36.67 - Attempt 2/10 for 9 pts. Part 1 What was the arithmetic average annual return? 4+ decimals Submit 5 5 2017 38.29 1.25 35.99 1.25 7 37.76 1.25 6 2018 7 2019 8 2020 9 2021 10 2022 35.76 1.3 9 35.79 1.3 36.67 | Attempt 2/10 for 9 pts. Part 1 What was the arithmetic average annual return? 4+ decimals Submit * Attempt 2/10 for 9 pts. Part 2 What was the standard deviation of returns? 4+ decimals Submit Problem 13 Intro Investing Shark Burgers has an expected annual return of 42% and a standard deviation of 21%. Part 1 - Attempt 2/10 for 9 pts. What is the probability of losing money on this investment? Assume that returns are normally distributed. A+ decimals Submit
Step by Step Solution
There are 3 Steps involved in it

Get step-by-step solutions from verified subject matter experts