

Question: The first three columns in the file 'wa_wheat contain observations on wheat yield in the Western Australian shires Northampton, Chapman Valley, and Mullewa, respectively.

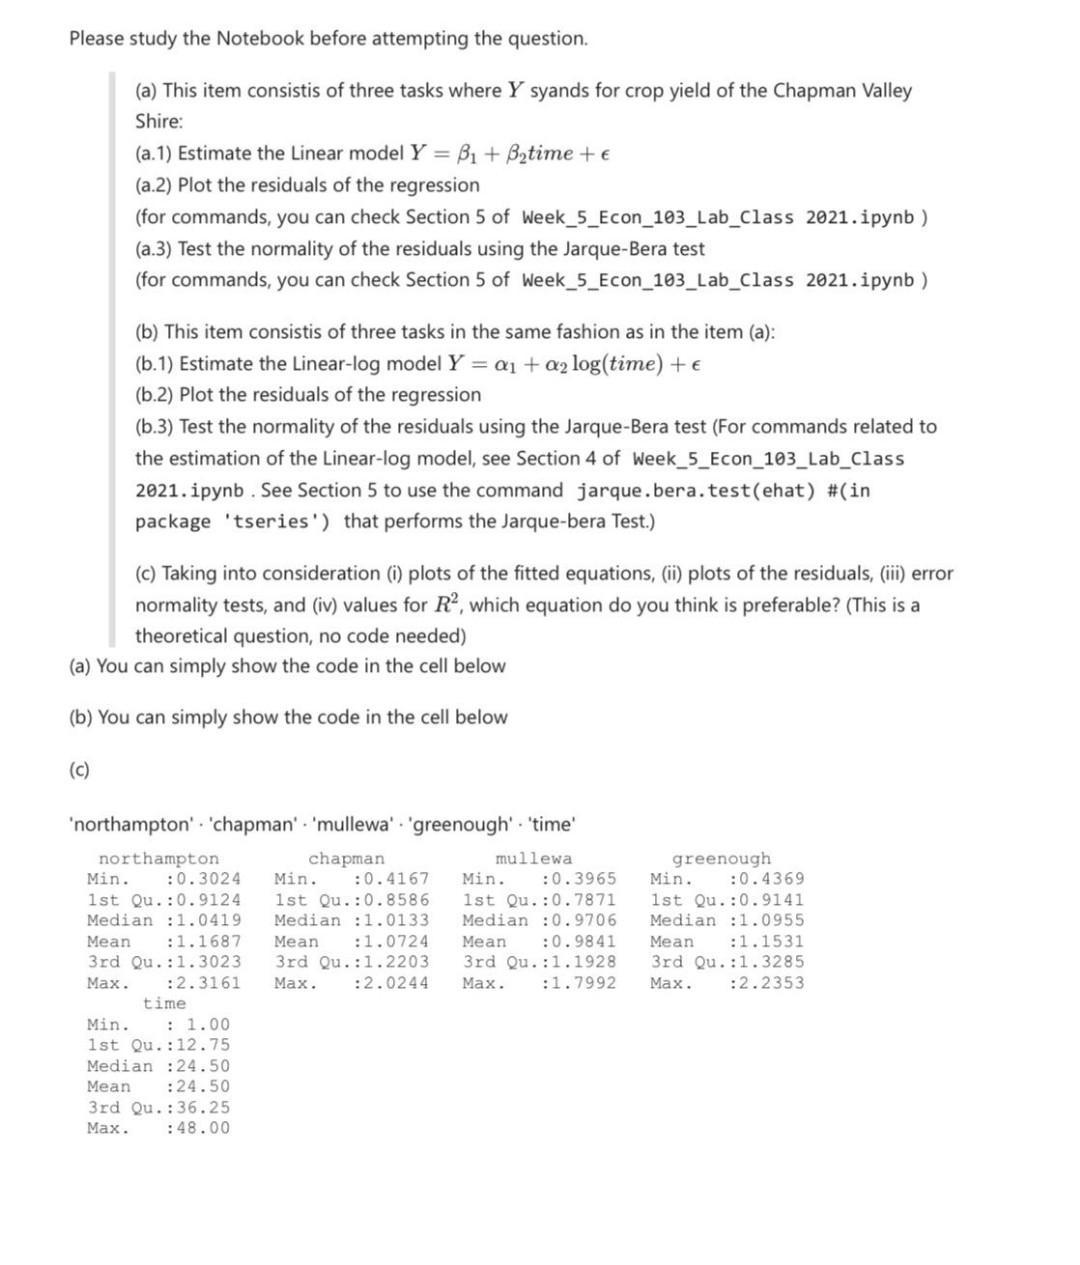
The first three columns in the file 'wa_wheat contain observations on wheat yield in the Western Australian shires Northampton, Chapman Valley, and Mullewa, respectively. There are 48 annual observations for the years 1950 - 1997. The name of the varibale that contains data on the crop yields of the Chapman Valley Shire is called chapman. For the Chapman Valley Shire, consider the four itens below: The tasks performed in this exercise requires the commands discussed in the Notebook 2021.ipynb Week_5_Econ_103_Lab_Class Please study the Notebook before attempting the question. (a) This item consistis of three tasks where Y syands for crop yield of the Chapman Valley Shire: (a.1) Estimate the Linear model Y = B + Btime + (a.2) Plot the residuals of the regression (for commands, you can check Section 5 of Week_5_Econ_103_Lab_Class 2021.ipynb) (a.3) Test the normality of the residuals using the Jarque-Bera test (for commands, you can check Section 5 of Week_5_Econ_103_Lab_Class 2021.ipynb) (c) Taking into consideration (i) plots of the fitted equations, (ii) plots of the residuals, (iii) error normality tests, and (iv) values for R, which equation do you think is preferable? (This is a theoretical question, no code needed) (a) You can simply show the code in the cell below (b) You can simply show the code in the cell below (c) (b) This item consistis of three tasks in the same fashion as in the item (a): (b.1) Estimate the Linear-log model Y = a + a log(time) + (b.2) Plot the residuals of the regression (b.3) Test the normality of the residuals using the Jarque-Bera test (For commands related to the estimation of the Linear-log model, see Section 4 of Week_5_Econ_103_Lab_Class 2021.ipynb. See Section 5 to use the command jarque.bera.test(ehat) #(in package 'tseries') that performs the Jarque-bera Test.) 'northampton' 'chapman' 'mullewa' 'greenough'. 'time' chapman mullewa :0.4167 Min. :0.4369 1st Qu. :0.9124 1st Qu.:0.8586 1st Qu. :0.7871 1st Qu. :0.9141 Median :1.0419 Median 1.0133 Median :0.9706 Median :1.0955 :1.1687 Mean :1.0724 Mean :0.9841 Mean :1.1531 gaa 3rd Qu. :1.3023 3rd Qu. :1.2203 3rd Qu. :1.1928 3rd Qu. :1.3285 :2.3161 Max. :2.0244 Max. :1.7992 Max. :2.2353 northampton Mean Min. :0.3024 Min. Max. time Min. : 1.00 1st Qu.:12.75 Median :24.50 Mean :24.50 3rd Qu.:36.25 Max. :48.00 greenough. :0.3965 Min.
Step by Step Solution
3.53 Rating (156 Votes )
There are 3 Steps involved in it
a1 To estimate the linear ... View full answer

Get step-by-step solutions from verified subject matter experts