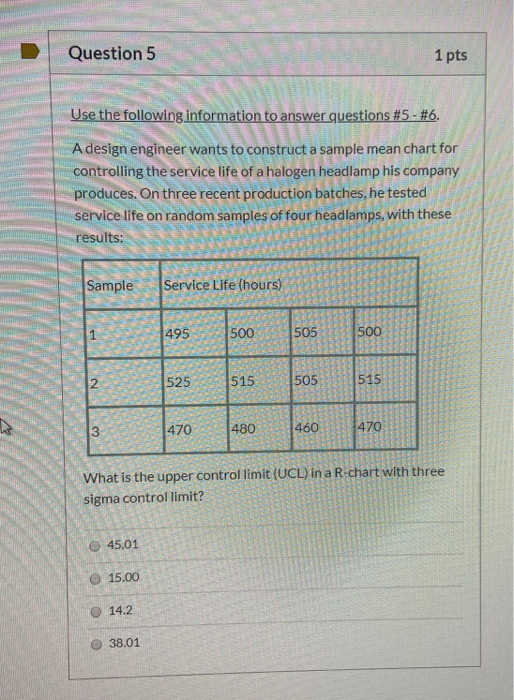
Question: / Question 5 Question 1 pts / le + Use the following information to answer questions #5 - #6. A design engineer wants to construct

/ Question 5 Question 1 pts / le + Use the
/ Question 5 Question 1 pts / le + Use the following information to answer questions #5 - #6. A design engineer wants to construct a sample mean chart for controlling the service life of a halogen headlamp his company produces. On three recent production batches, he tested service life on random samples of four headlamps, with these results: Sample Service Life (hours) 495 500 505 500 525 515 505 470 480 460 470 What is the upper controllimit (UCL) in a R-chart with three sigma control limit? 45.01 15.00 14.2 38.01 Question 6 1 pts If he uses upper and lower control limits of 520 and 480 hours in the x-bar chart, on what sample(s) (if any) does service life appear to be out of control? both samples 2 and 3 KD sample 2 sample 1 sample 3 all samples are in control L LLLL

Step by Step Solution

There are 3 Steps involved in it

1 Expert Approved Answer
Step: 1 Unlock blur-text-image
Question Has Been Solved by an Expert!

Get step-by-step solutions from verified subject matter experts

Step: 2 Unlock
Step: 3 Unlock

Students Have Also Explored These Related General Management Questions!