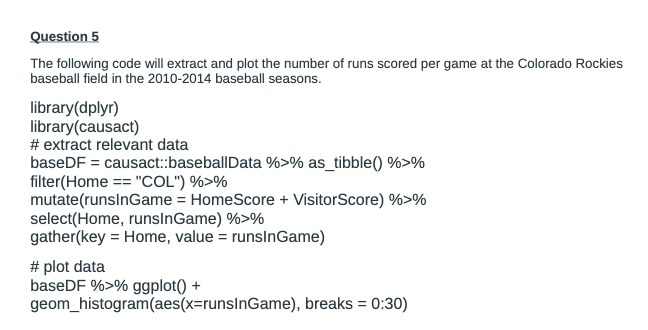
Question: Question 5 The following code will extract and plot the number of runs scored per game at the Colorado Rockies baseball field in the 2010-2014

Question 5 The following code will extract and
Question 5 The following code will extract and plot the number of runs scored per game at the Colorado Rockies baseball field in the 2010-2014 baseball seasons. library(dplyr) library(causact) # extract relevant data baseDF = causact::baseballData %>% as_tibble() %>% filter(Home == "COL") %>% mutate(runsInGame = HomeScore + VisitorScore) %>% select(Home, runsinGame) %>% gather(key = Home, value = runsInGame) # plot data baseDF %>% ggplot() + geom_histogram(aes(x=runsInGame), breaks = 0:30)

Step by Step Solution

There are 3 Steps involved in it

1 Expert Approved Answer
Step: 1 Unlock blur-text-image
Question Has Been Solved by an Expert!

Get step-by-step solutions from verified subject matter experts

Step: 2 Unlock
Step: 3 Unlock

Students Have Also Explored These Related Mathematics Questions!