

Question: Question # 5 : Use Excel to display a time - series chart to display the data shown in the table. The following data represents
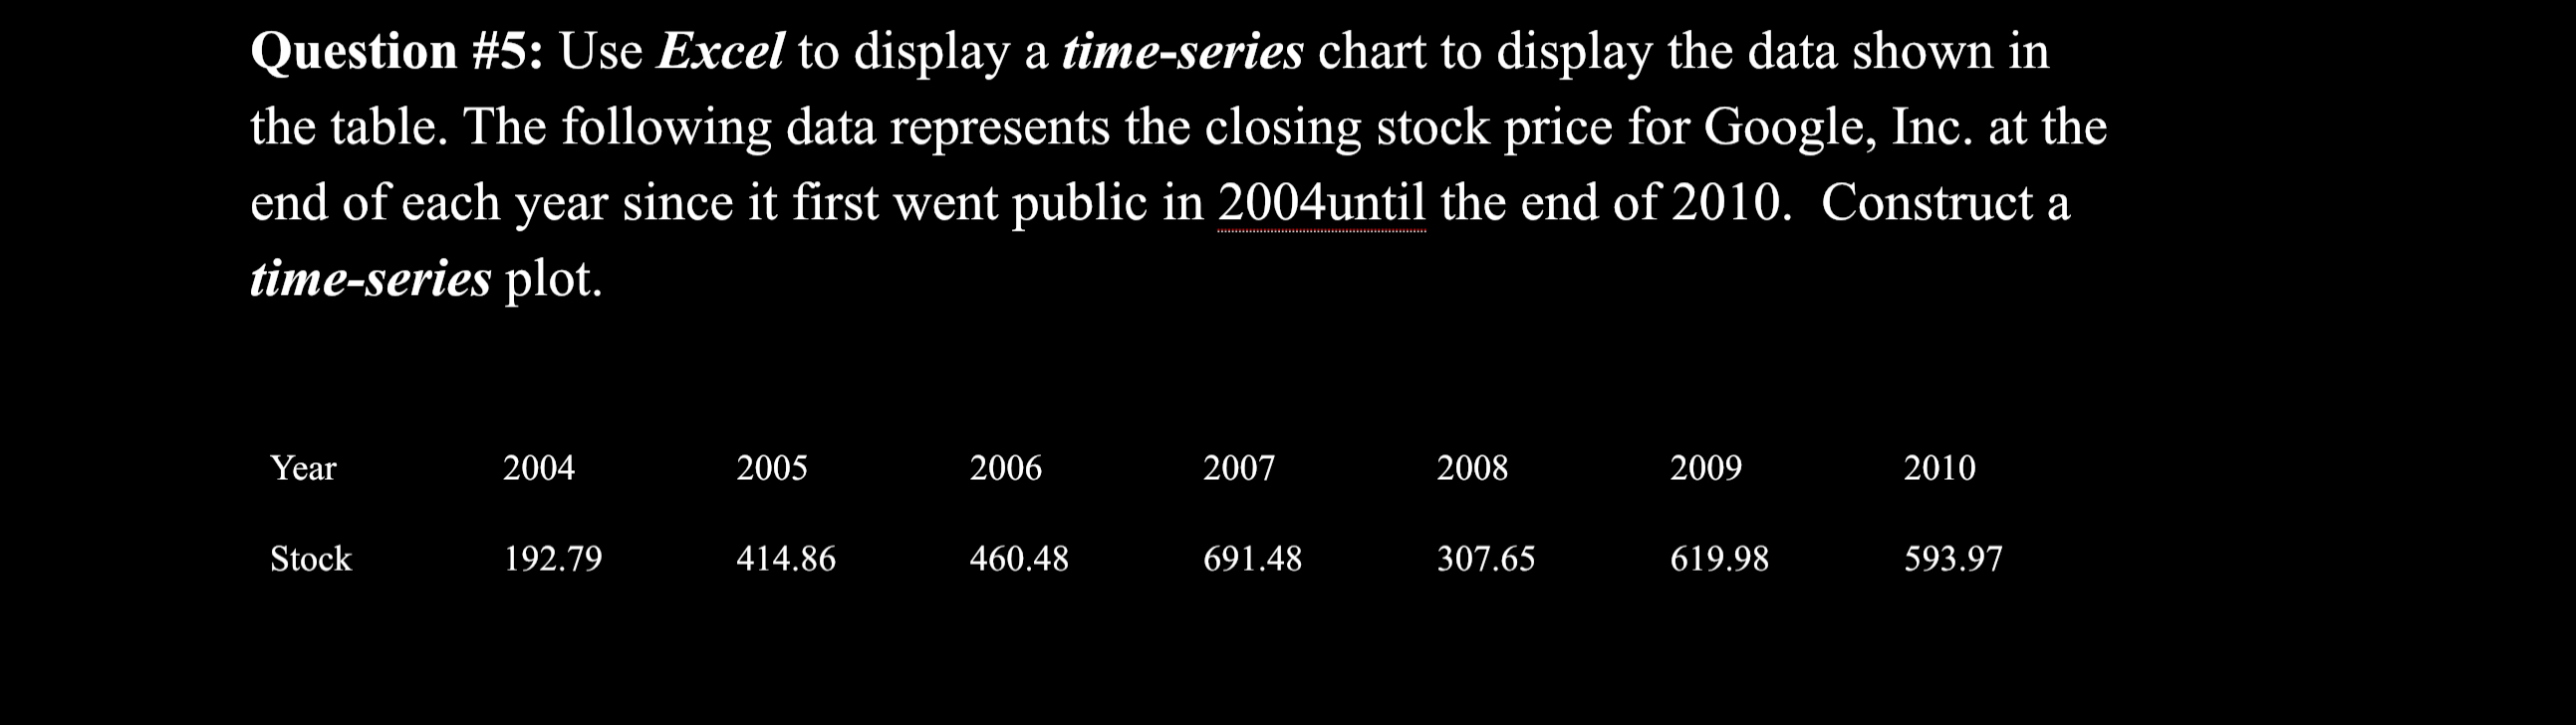
Question #: Use Excel to display a timeseries chart to display the data shown in the table. The following data represents the closing stock price for Google, Inc. at the end of each year since it first went public in until the end of Construct a timeseries plot.YearStockQuestion #: Use Excel to display a timeseries chart to display the data shown in
the table. The following data represents the closing stock price for Google, Inc. at the
end of each year since it first went public in until the end of Construct a
timeseries plot.
Step by Step Solution
There are 3 Steps involved in it
1 Expert Approved Answer
Step: 1 Unlock

Question Has Been Solved by an Expert!
Get step-by-step solutions from verified subject matter experts
Step: 2 Unlock
Step: 3 Unlock