

Question: Question 53 (1 point) Figure 5. The vertical distance between points A and B represents a tax in the market. Price 28 26 . 24
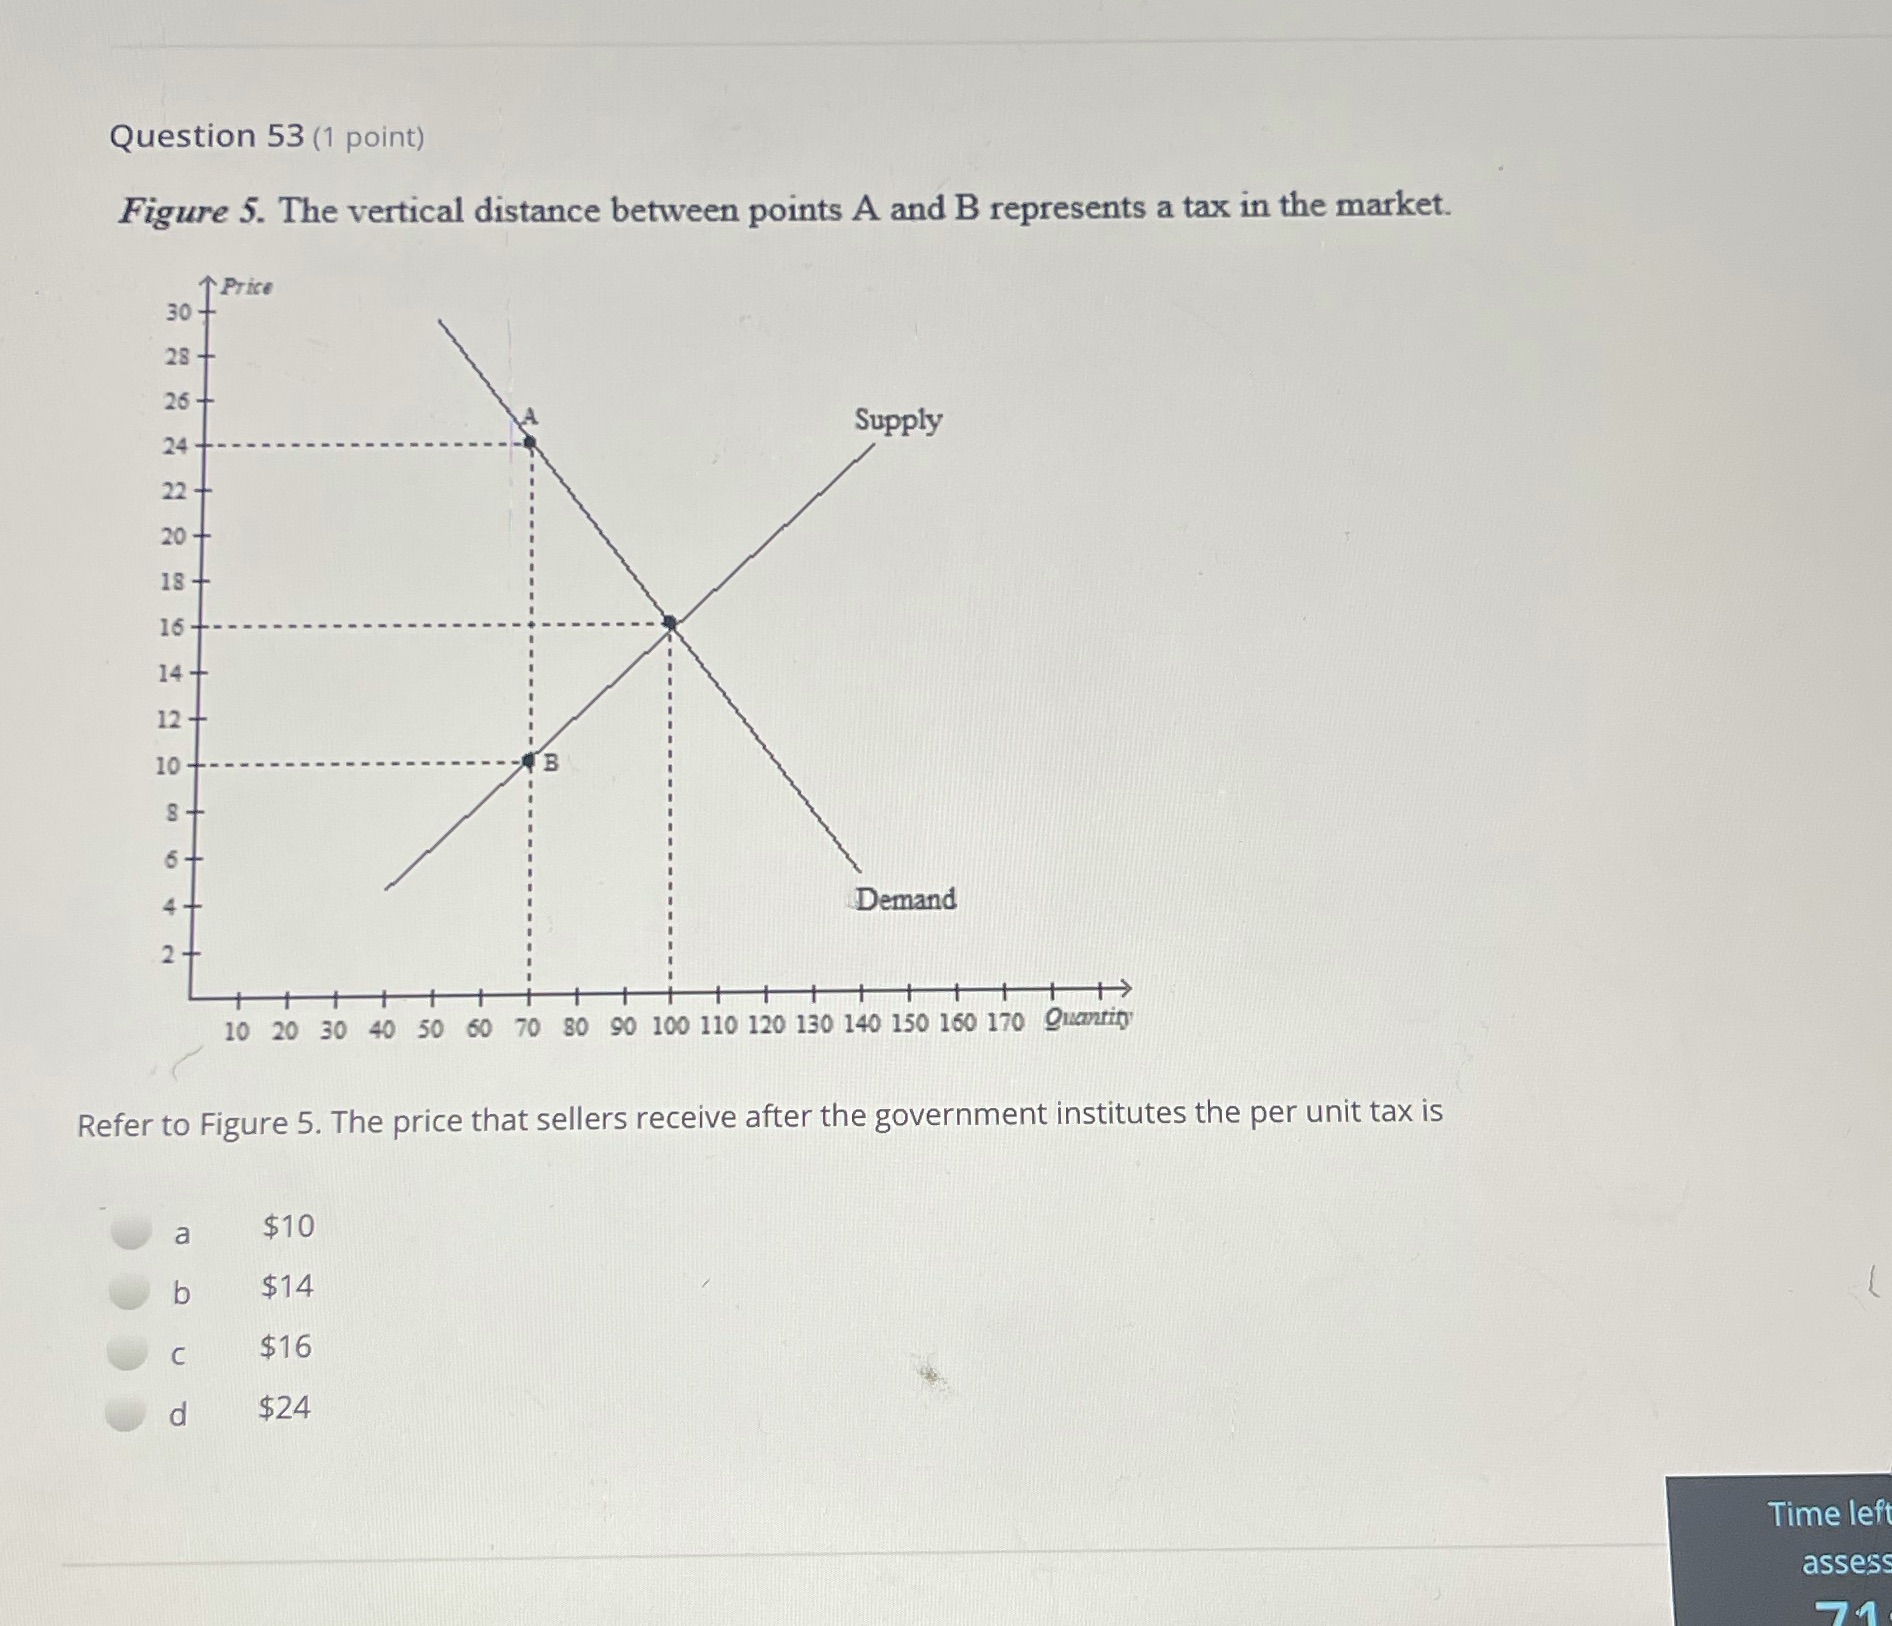
Question 53 (1 point) Figure 5. The vertical distance between points A and B represents a tax in the market. Price 28 26 . 24 . Supply 22 - 20 - 18+ 16- 14 - 12 + 10 +- 8 - 6+ Demand N 10 20 30 40 50 60 70 80 90 100 110 120 130 140 150 160 170 Quantity Refer to Figure 5. The price that sellers receive after the government institutes the per unit tax is a $10 b $14 C $16 d $24 Time lef assess
Step by Step Solution
There are 3 Steps involved in it
1 Expert Approved Answer
Step: 1 Unlock

Question Has Been Solved by an Expert!
Get step-by-step solutions from verified subject matter experts
Step: 2 Unlock
Step: 3 Unlock