

Question: Question 6 0.5 at: The given graph represents a population with a Normal distribution. Hint: Apply the 68%, 9596. 99.?% rule Approximately what pertent at
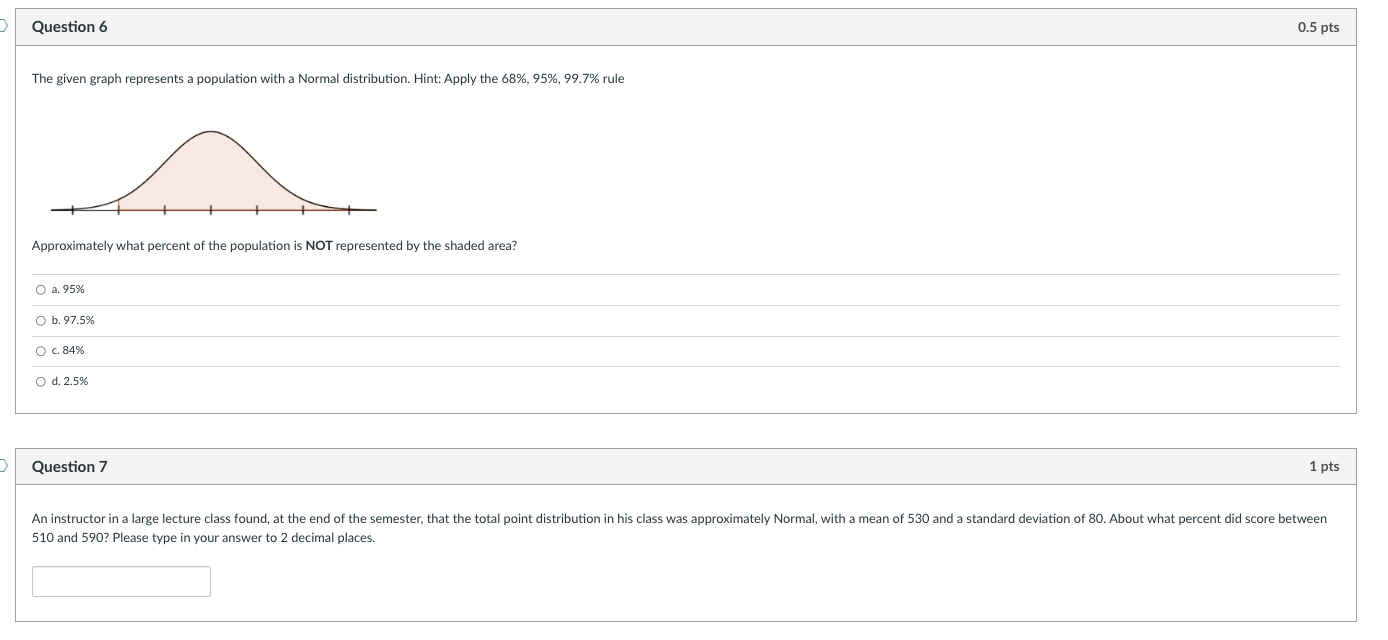
Question 6 0.5 at: The given graph represents a population with a Normal distribution. Hint: Apply the 68%, 9596. 99.?% rule Approximately what pertent at the population is NOT represented by the shaded area? 0 a 95% o h. 97.5% o r. 84% 0 11.15% Question 7 1 pt: An instructor in a large lecture elass found. at the end of the semester, that the total point distribution in his elass was approximately Normal. with a mean of 53-0 and a standard deviation of 80. About what pencent did score between 510 and 590? Please type in your answer to 2 decimal places
Step by Step Solution
There are 3 Steps involved in it
1 Expert Approved Answer
Step: 1 Unlock

Question Has Been Solved by an Expert!
Get step-by-step solutions from verified subject matter experts
Step: 2 Unlock
Step: 3 Unlock