

Question: Question 6 (1 marks Use the following table to answer the questions a-b below. Risky Portfolio Expected return on Standard deviation Risk-free return Sharpe ratio
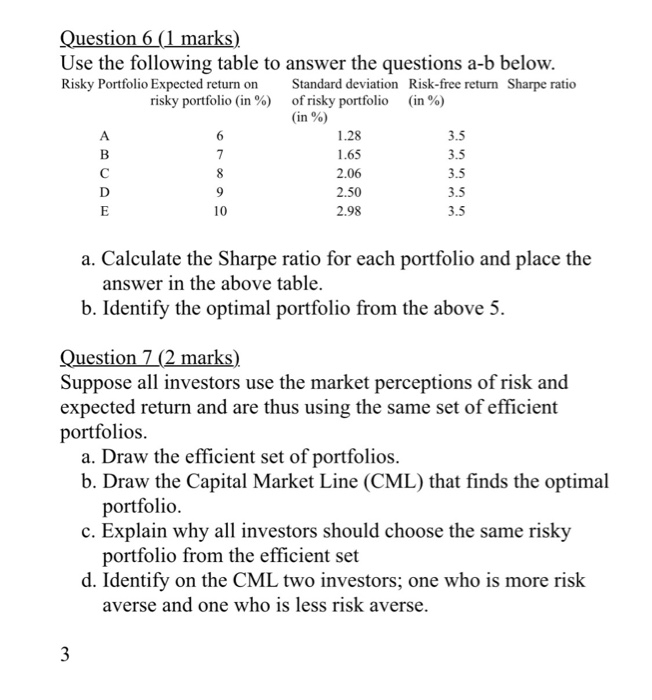
Question 6 (1 marks Use the following table to answer the questions a-b below. Risky Portfolio Expected return on Standard deviation Risk-free return Sharpe ratio risky portfolio (in %) of risky portfolio (in %) (in %) A 6 1.28 3.5 B 7 1.65 3.5 8 2.06 D 9 2.50 E 10 2.98 3.5 3.5 3.5 a. Calculate the Sharpe ratio for each portfolio and place the answer in the above table. b. Identify the optimal portfolio from the above 5. Question 7 (2 marks) Suppose all investors use the market perceptions of risk and expected return and are thus using the same set of efficient portfolios. a. Draw the efficient set of portfolios. b. Draw the Capital Market Line (CML) that finds the optimal portfolio c. Explain why all investors should choose the same risky portfolio from the efficient set d. Identify on the CML two investors; one who is more risk averse and one who is less risk averse. 3
Step by Step Solution
There are 3 Steps involved in it

Get step-by-step solutions from verified subject matter experts