

Question: Question 6 (1 point) 6 4 2 -2 2 -2 The graph of the function fis shown in the figure above. Answ question about f.
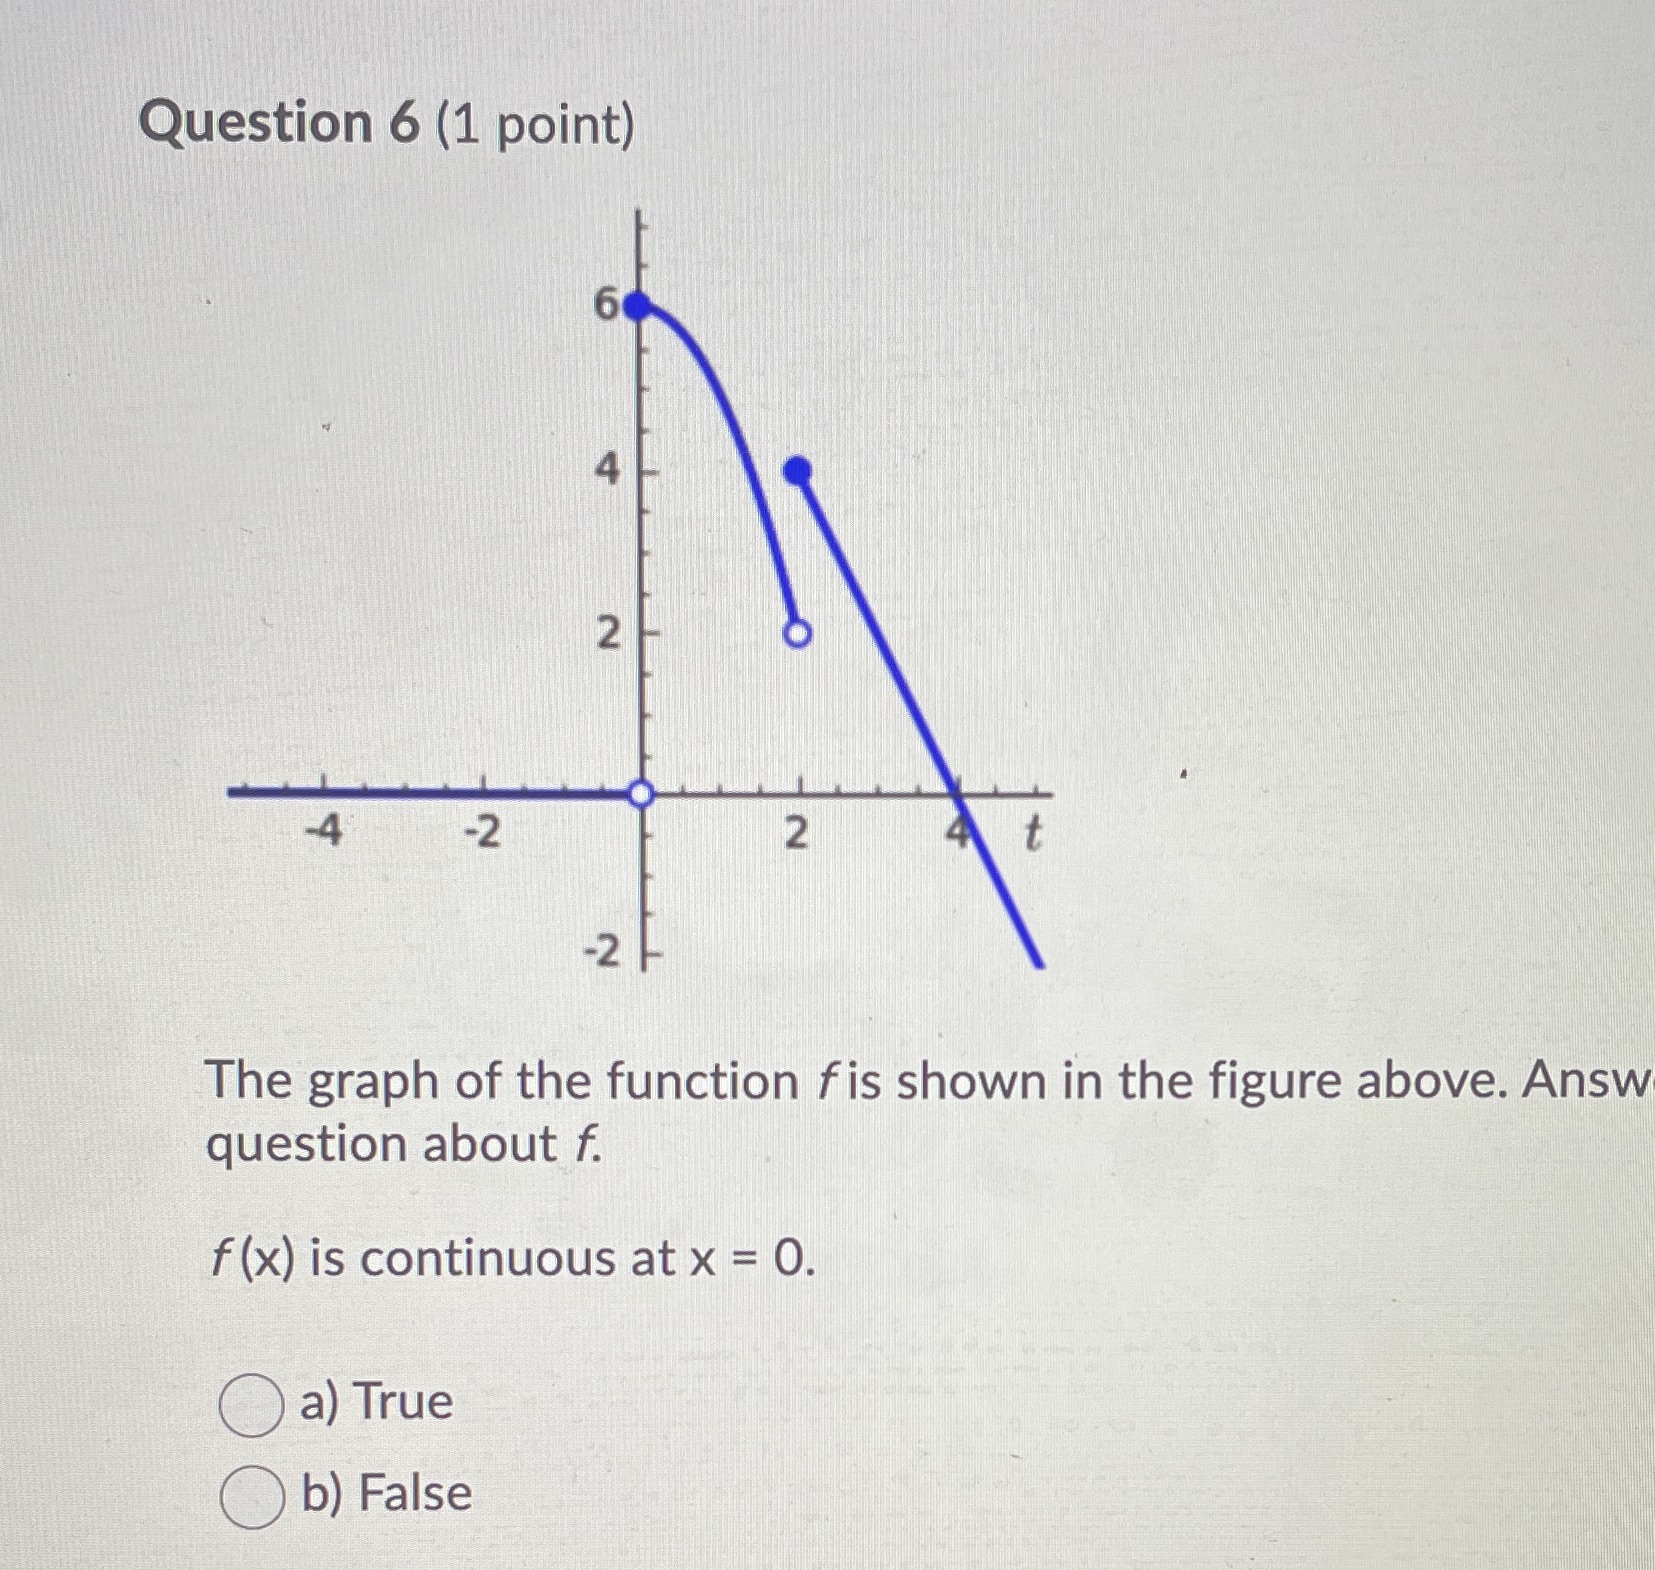
Question 6 (1 point) 6 4 2 -2 2 -2 The graph of the function fis shown in the figure above. Answ question about f. f (x) is continuous at x = 0. ( a) True b) False
Step by Step Solution
There are 3 Steps involved in it
1 Expert Approved Answer
Step: 1 Unlock

Question Has Been Solved by an Expert!
Get step-by-step solutions from verified subject matter experts
Step: 2 Unlock
Step: 3 Unlock