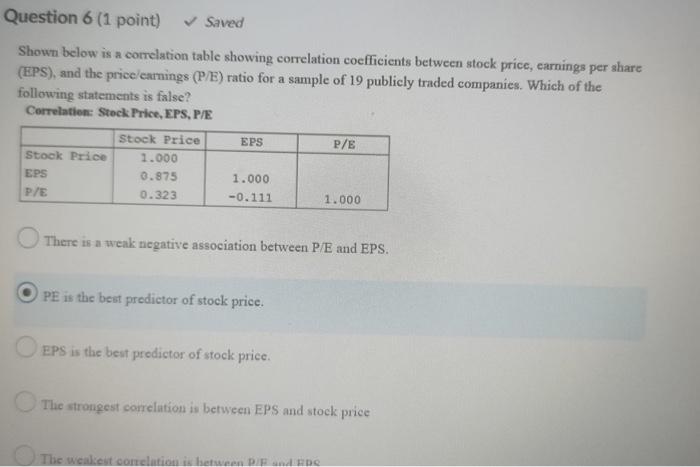
Question: Question 6 (1 point) Saved Shown below is a correlation table showing correlation coefficients between stock price, earnings per share (EPS), and the price/carnings (P/E)

Question 6 (1 point) Saved Shown below is a
Question 6 (1 point) Saved Shown below is a correlation table showing correlation coefficients between stock price, earnings per share (EPS), and the price/carnings (P/E) ratio for a sample of 19 publicly traded companies. Which of the following statements is false? Correlation: Stock Price, EPS, P/E Stock Price EPS P/E Stock Price 1.000 EPS 0.875 1.000 P/E 0.323 -0.111 1.000 There is a weak negative association between P/E and EPS. PE is the best predictor of stock price. EPS is the best predictor of stock price. The strongest correlation is between EPS and stock price The weakest correlation is between P/F and EDC Price/kg If the point in the lower left hand corner ($2.00 per kilogram, 6 grams of fat) were removed, the correlation would most likely become stronger negative become positive remain the same become zero Obecome weaker negative

Step by Step Solution

There are 3 Steps involved in it

1 Expert Approved Answer
Step: 1 Unlock blur-text-image
Question Has Been Solved by an Expert!

Get step-by-step solutions from verified subject matter experts

Step: 2 Unlock
Step: 3 Unlock

Students Have Also Explored These Related General Management Questions!