

Question: . Question 6 18 16 14 10 Frequency Co a. 6.5 5.5 10.5 15.5 20.5 25.5 30.5 35.54 40.5 45.5 50.5 Dentist Wait Times (minutes)
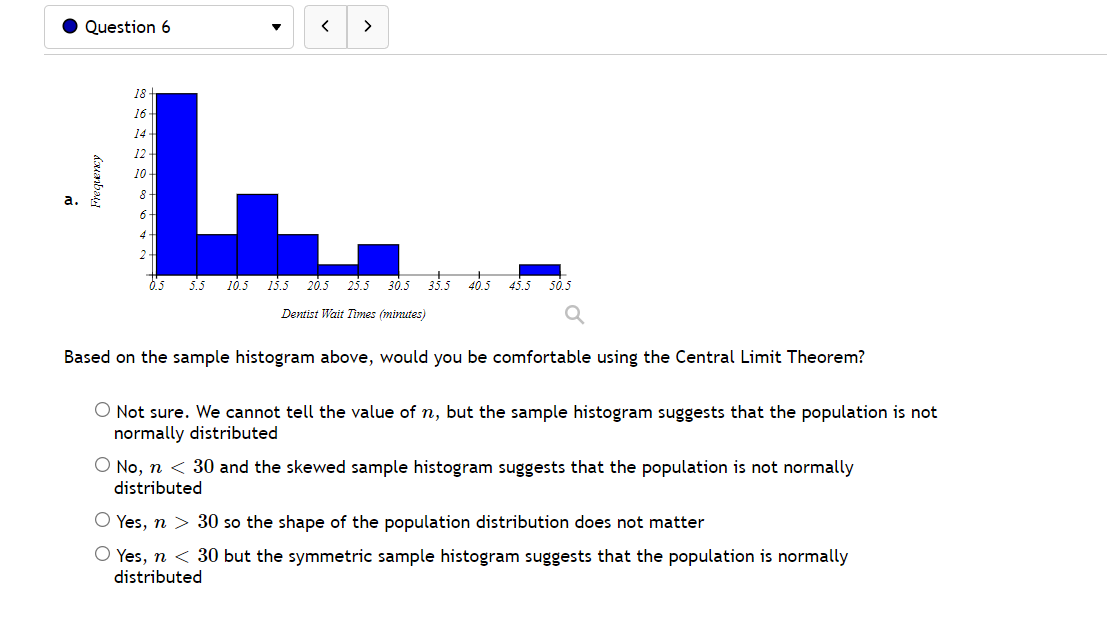
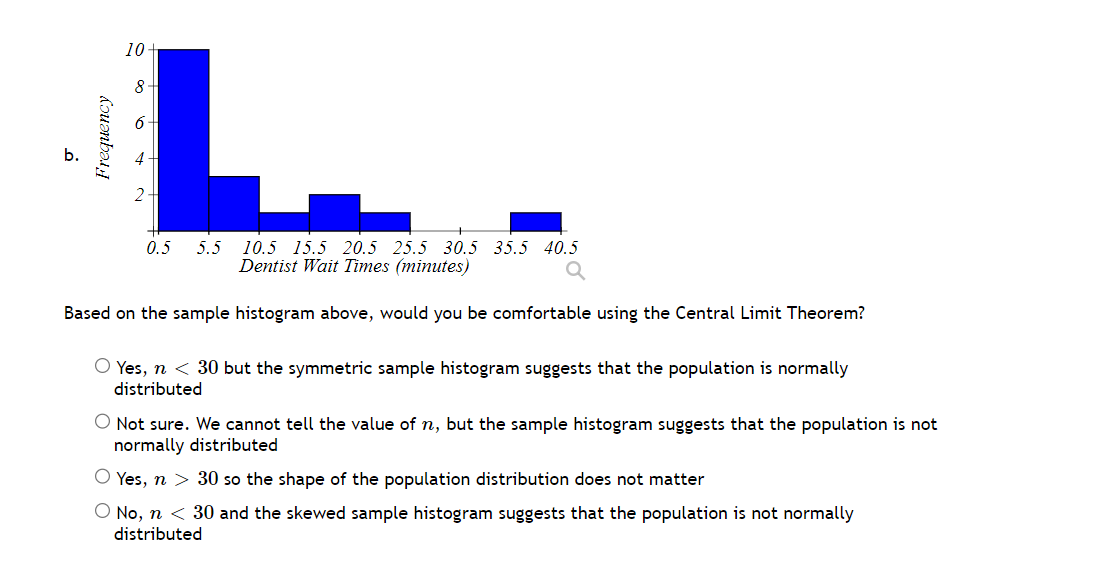
. Question 6 18 16 14 10 Frequency Co a. 6.5 5.5 10.5 15.5 20.5 25.5 30.5 35.54 40.5 45.5 50.5 Dentist Wait Times (minutes) Q Based on the sample histogram above, would you be comfortable using the Central Limit Theorem? O Not sure. We cannot tell the value of n, but the sample histogram suggests that the population is not normally distributed O No, n 30 so the shape of the population distribution does not matter O Yes, n 30 so the shape of the population distribution does not matter '33:? No, n (L 30 and the skewed sample histogram suggests that the population is not normally distributed
Step by Step Solution
There are 3 Steps involved in it
1 Expert Approved Answer
Step: 1 Unlock

Question Has Been Solved by an Expert!
Get step-by-step solutions from verified subject matter experts
Step: 2 Unlock
Step: 3 Unlock