

Question: Question #6 (6 marks) Consider the given graph of a function, N (3') showing the number of daily new cases of an infectious disease over
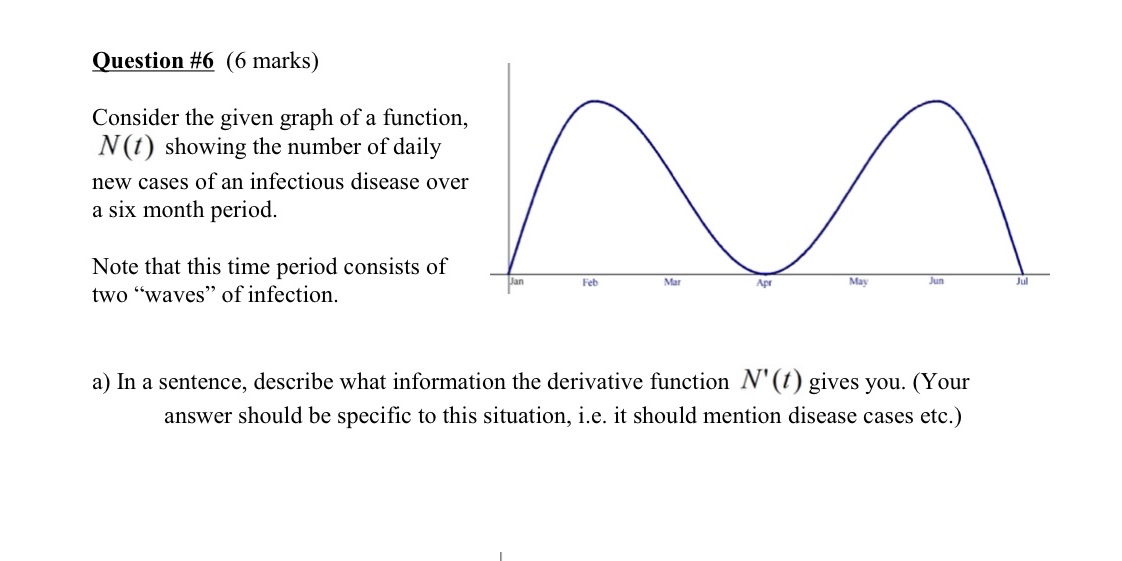
Question #6 (6 marks) Consider the given graph of a function, N (3') showing the number of daily new cases of an infectious disease over a six month period. Note that this time period consists of two \"waves\" of infection. a) In a sentence, describe what information the derivative function N ' (I ) gives you. (Your answer should be specic to this situation, i.e. it should mention disease cases etc.)
Step by Step Solution
There are 3 Steps involved in it
1 Expert Approved Answer
Step: 1 Unlock

Question Has Been Solved by an Expert!
Get step-by-step solutions from verified subject matter experts
Step: 2 Unlock
Step: 3 Unlock