

Question: Question 6 A plot/graph of the positive relation between systematic risk and expected return is called: O security market line O standard deviation and width
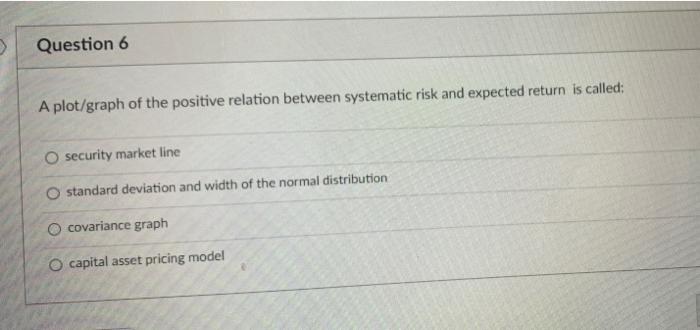
Question 6 A plot/graph of the positive relation between systematic risk and expected return is called: O security market line O standard deviation and width of the normal distribution o covariance graph O capital asset pricing model
Step by Step Solution
There are 3 Steps involved in it
1 Expert Approved Answer
Step: 1 Unlock

Question Has Been Solved by an Expert!
Get step-by-step solutions from verified subject matter experts
Step: 2 Unlock
Step: 3 Unlock