

Question: QUESTION 6 ) A river has a heavily - polluted discharge of wastewater from industrial area entering it at a flow rate of 0 .
QUESTION
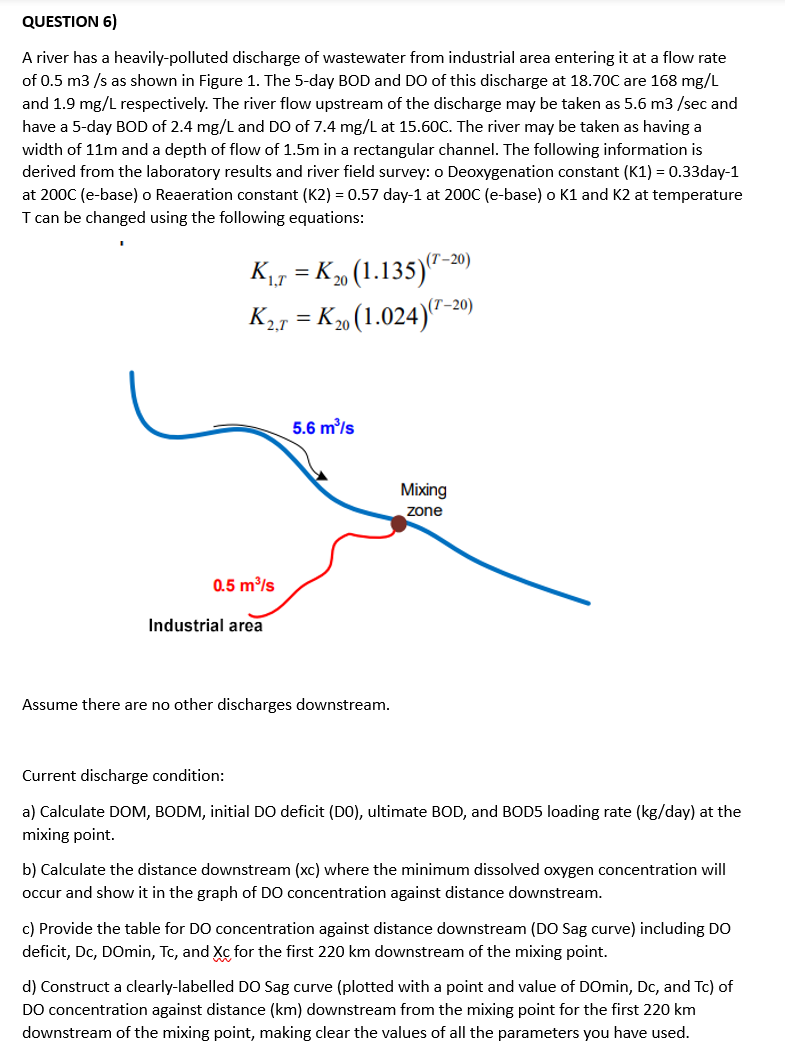
A river has a heavilypolluted discharge of wastewater from industrial area entering it at a flow rate
of as shown in Figure The day BOD and DO of this discharge at are
and respectively. The river flow upstream of the discharge may be taken as and
have a day BOD of and DO of at The river may be taken as having a
width of and a depth of flow of in a rectangular channel. The following information is
derived from the laboratory results and river field survey: o Deoxygenation constant day
at C ebase o Reaeration constant K day at ebase o K and K at temperature
can be changed using the following equations:
Assume there are no other discharges downstream.
Current discharge condition:
a Calculate DOM, BODM, initial DO deficit DO ultimate BOD, and BOD loading rate kgday at the
mixing point.
b Calculate the distance downstream xc where the minimum dissolved oxygen concentration will
occur and show it in the graph of DO concentration against distance downstream.
c Provide the table for DO concentration against distance downstream DO Sag curve including DO
deficit, Dc DOmin, Tc and for the first downstream of the mixing point.
d Construct a clearlylabelled DO Sag curve plotted with a point and value of DOmin, Dc and Tc of
DO concentration against distance downstream from the mixing point for the first
downstream of the mixing point, making clear the values of all the parameters you have used.
Step by Step Solution
There are 3 Steps involved in it
1 Expert Approved Answer
Step: 1 Unlock

Question Has Been Solved by an Expert!
Get step-by-step solutions from verified subject matter experts
Step: 2 Unlock
Step: 3 Unlock