

Question: Question 6) A school board is trying to evaluate a new math program introduced to second graders in five elementary schools. A sample of the
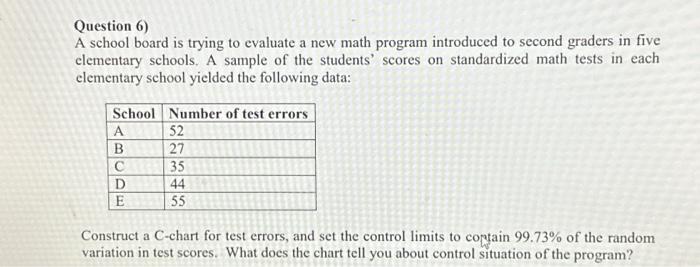
Question 6) A school board is trying to evaluate a new math program introduced to second graders in five elementary schools. A sample of the students' scores on standardized math tests in each elementary school yielded the following data: School Number of test errors A 52 B 27 C 35 D 44 E 55 Construct a C-chart for test errors, and set the control limits to contain 99.73% of the random variation in test scores. What does the chart tell you about control situation of the program?
Question 6) A school board is trying to evaluate a new math program introduced to second graders in five elementary schools. A sample of the students' scores on standardized math tests in each elementary school yielded the following data: Construct a C-chart for test errors, and set the control limits to covain 99.73% of the random variation in test scores. What does the chart tell you about control situation of the program
Step by Step Solution
There are 3 Steps involved in it
1 Expert Approved Answer
Step: 1 Unlock

Question Has Been Solved by an Expert!
Get step-by-step solutions from verified subject matter experts
Step: 2 Unlock
Step: 3 Unlock