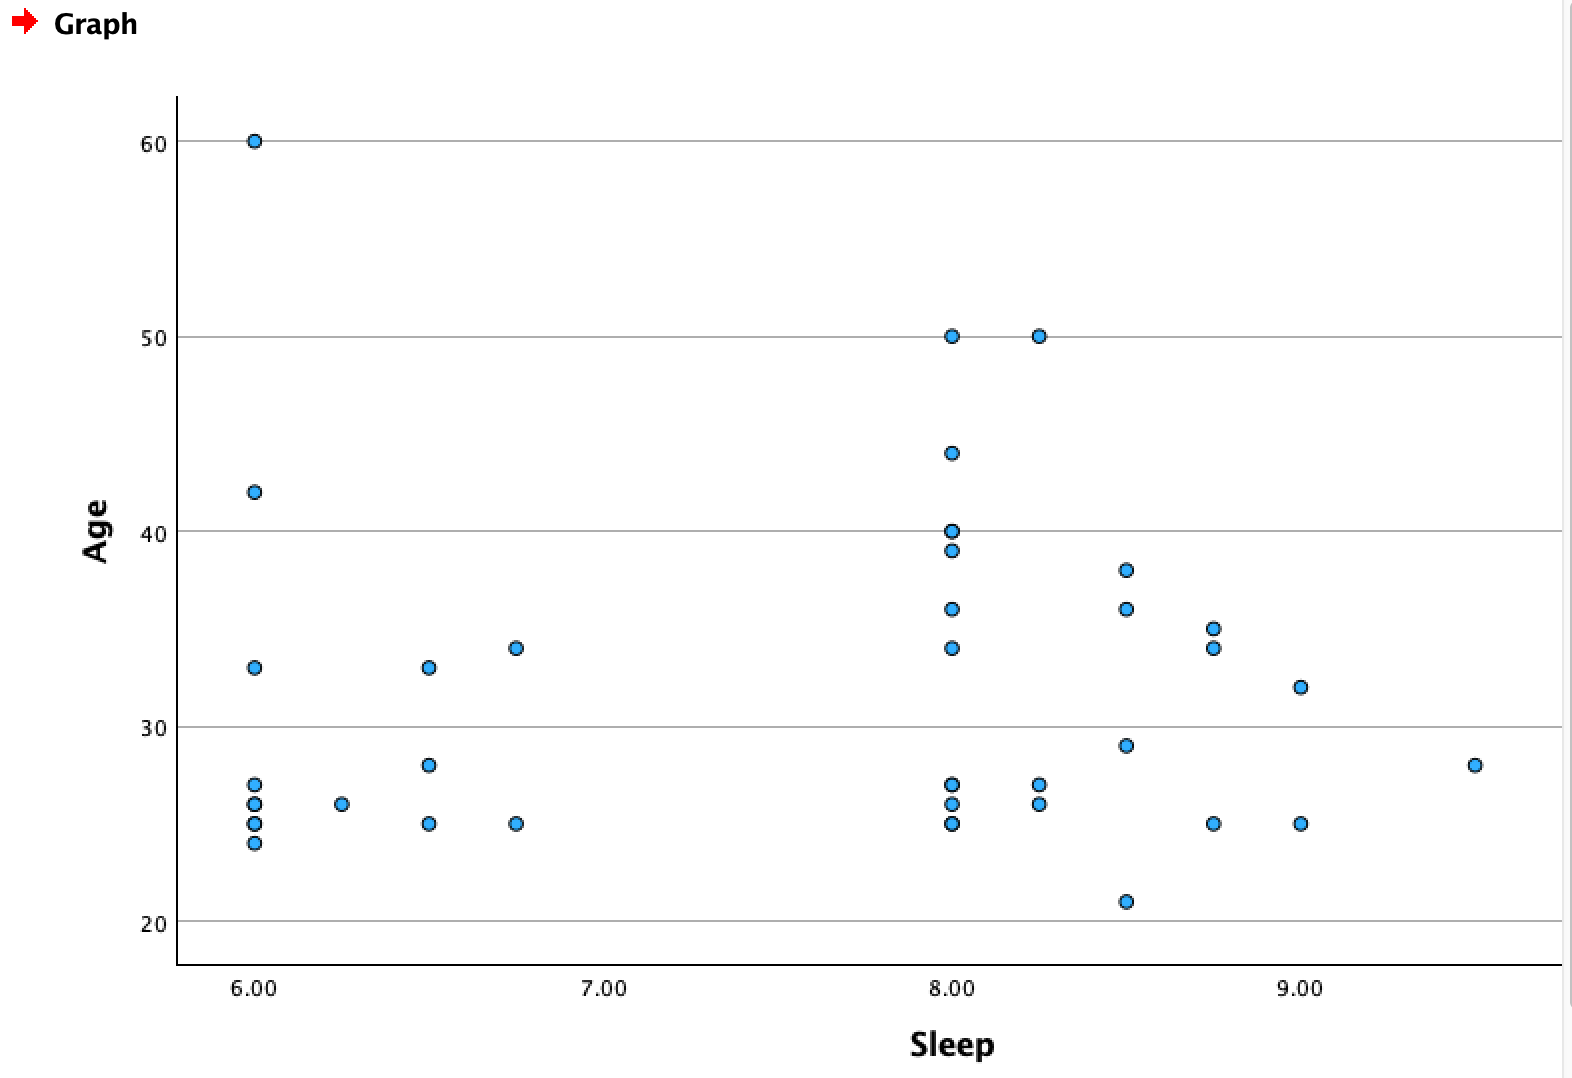
Question: Question 6 A,B,C + Graph 60 O 50 O- Age 40 . . .0 . OO O O 30 O O OO . O 20

Question 6 A,B,C

Question 6 A,B,C + Graph 60 O 50 O- Age 40 . . .0Question 6 A,B,C + Graph 60 O 50 O- Age 40 . . .0
+ Graph 60 O 50 O- Age 40 . . .0 . OO O O 30 O O OO . O 20 6.00 7.00 8.00 9.00 SleepQ6. Create a scatterplot and identify the relationship between the two variables. (5 pts.) Use SPSS to create a scatterplot for comparing the variable "age" to the variable "sleep." Cut- and-paste the scatterplot below. Then answer the questions about the data. A. Is there a positive or negative relationship between age and sleep for this data set? B. Based on the scatterplot, is the relationship between age and sleep weak, moderate, or strong? Explain using your knowledge of scatterplots. C. Use SPSS to calculate the Pearson's correlation coefficient, r, that describes the relationship between age and sleep. Pearson's r =

Step by Step Solution

There are 3 Steps involved in it

1 Expert Approved Answer
Step: 1 Unlock blur-text-image
Question Has Been Solved by an Expert!

Get step-by-step solutions from verified subject matter experts

Step: 2 Unlock
Step: 3 Unlock

Students Have Also Explored These Related Mathematics Questions!