

Question: Question 6. Create a line plot of the PTER over time. To do this create a new table called pter_over_time that adds the year array
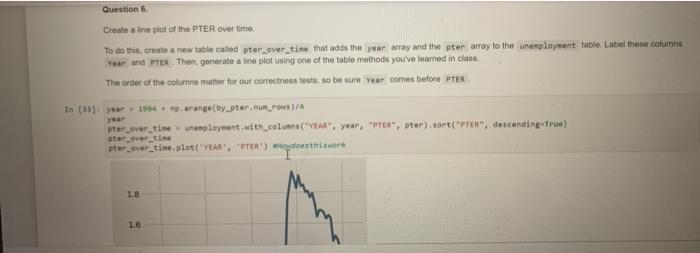

Question 6. Create a line plot of the PTER over time. To do this create a new table called pter_over_time that adds the year array and the pter array to the unemployment table. Label these columns Year and PTER. Then, generate in line plot using one of the table methods you've learned in class. The order of the columno matter for our correctness tests, to be sure year comes before Pro In [] year 1994 orange(by_pter numrows/4 pter_over_time - unemployment, with columns("YEAR". year, PTER, pter) sort("PE", descending True) pter over time pter over time.plot('YEAR, PER) adostnimo 1.8 16 CVIV YEAR [ ]: #WHAT_IS_THE_CORRECT_ANSWER??|| Question 6. Create a line plot of the PTER over time. To do this create a new table called pter_over_time that adds the year array and the pter array to the unemployment table. Label these columns Year and PTER. Then, generate in line plot using one of the table methods you've learned in class. The order of the columno matter for our correctness tests, to be sure year comes before Pro In [] year 1994 orange(by_pter numrows/4 pter_over_time - unemployment, with columns("YEAR". year, PTER, pter) sort("PE", descending True) pter over time pter over time.plot('YEAR, PER) adostnimo 1.8 16 CVIV YEAR [ ]: #WHAT_IS_THE_CORRECT_ANSWER??||
Step by Step Solution
There are 3 Steps involved in it

Get step-by-step solutions from verified subject matter experts